
FS RAMS — Master Reference
Interactive index of the road-asset data processes from TMH 18, TMH 22 and TRH 26, with the FS RAMP schedule. Open a process, then click any block in its diagram to see the detail and jump to the source document.
Prepared 13 July 2026 · Free State Provincial RAMS · Updated 23 July 2026 — added the Process Sequence & Feedback Map, TRH 26 / TMH 18 / TMH 14 process flows and the project WBS (Rev A).
The Annual Cycle — How It Should Happen
The FS RAMS data cycle in the order it must run. Click a step to open its full process flow, or use the green chips for the related tabs. Steps 1–2 are the once-off foundation; Steps 3–7 repeat every year. Dashed red boxes are the feedback loops that pull the cycle back.
Golden rules: the network loads before any new data · every record references the loaded network (ROAD_ID + km) · nothing loads without passing Gates 2–3.
2.1 · TMH 18 Data & GIS Process
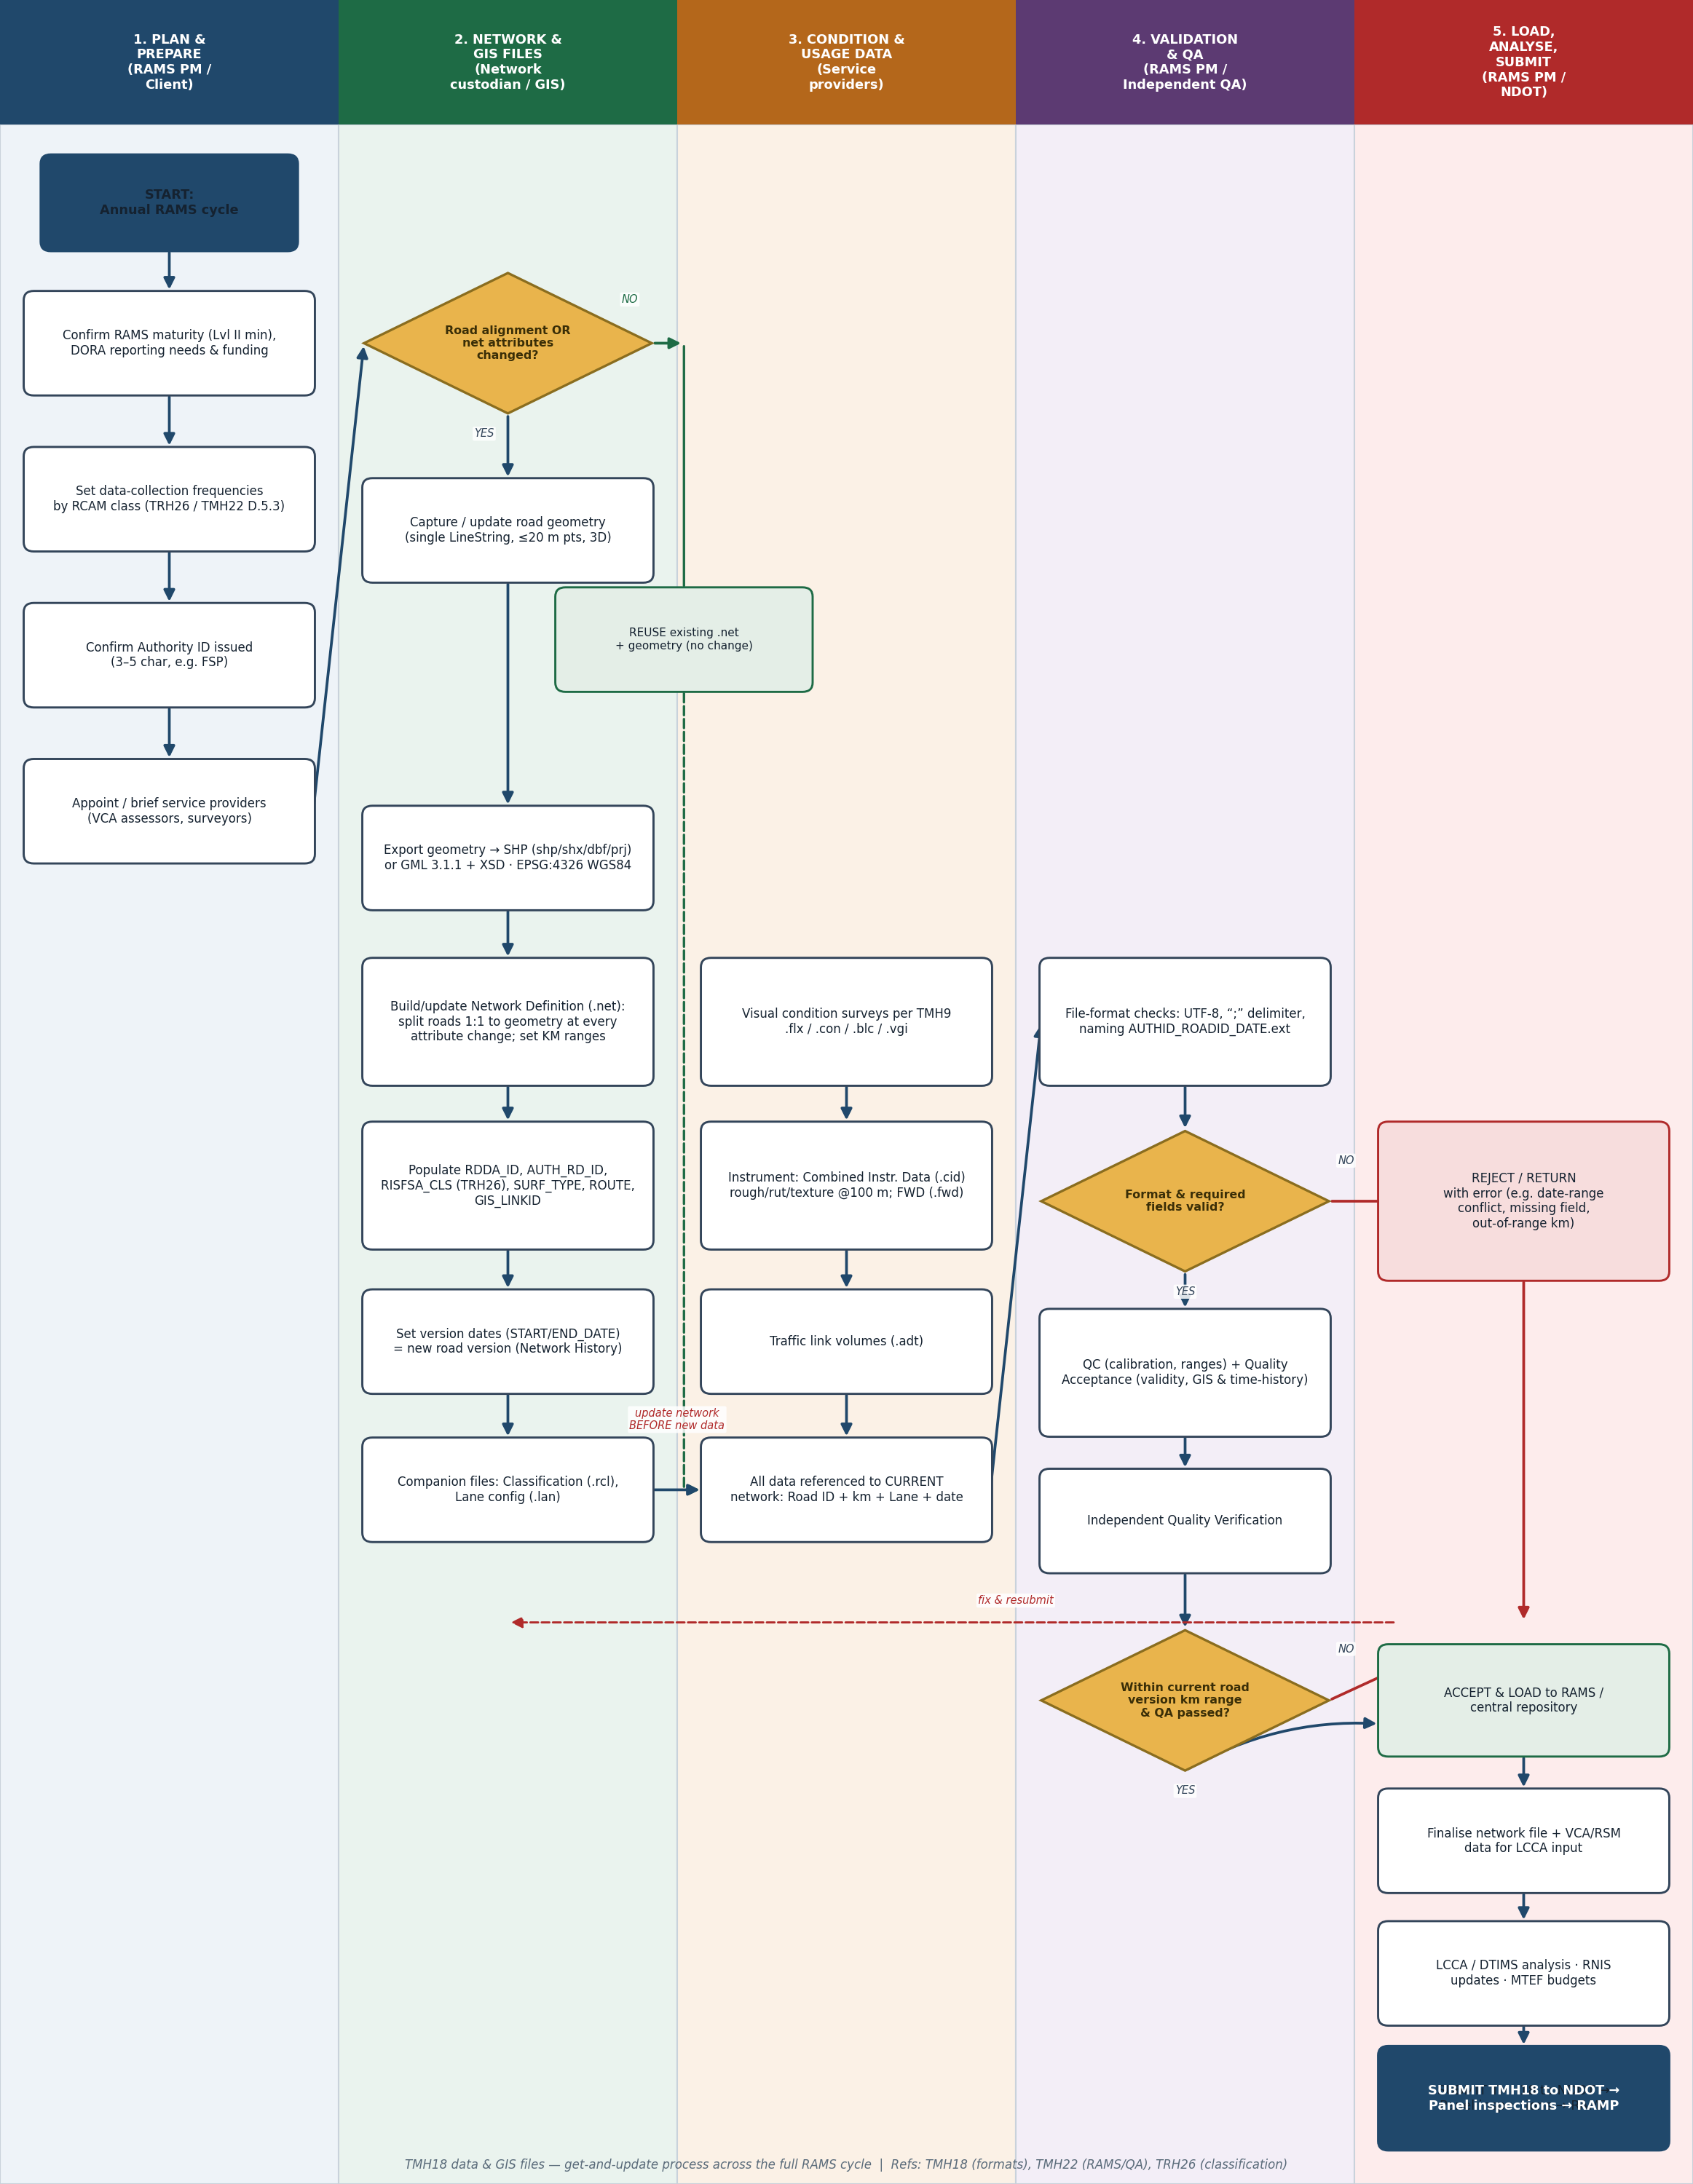
The end-to-end annual cycle for obtaining and updating the TMH 18 data files and GIS geometry, across five responsibility lanes with three decision gates. Click any block to see its details and jump to the source document.
1.2 · Road Network Topology
How a road is subdivided so every data point is located by kilometre: Route ▸ Road ▸ Section ▸ Link ▸ Node ▸ Segment.
⬇ Download this diagram as PDF (FS_Road_Network_Topology.pdf)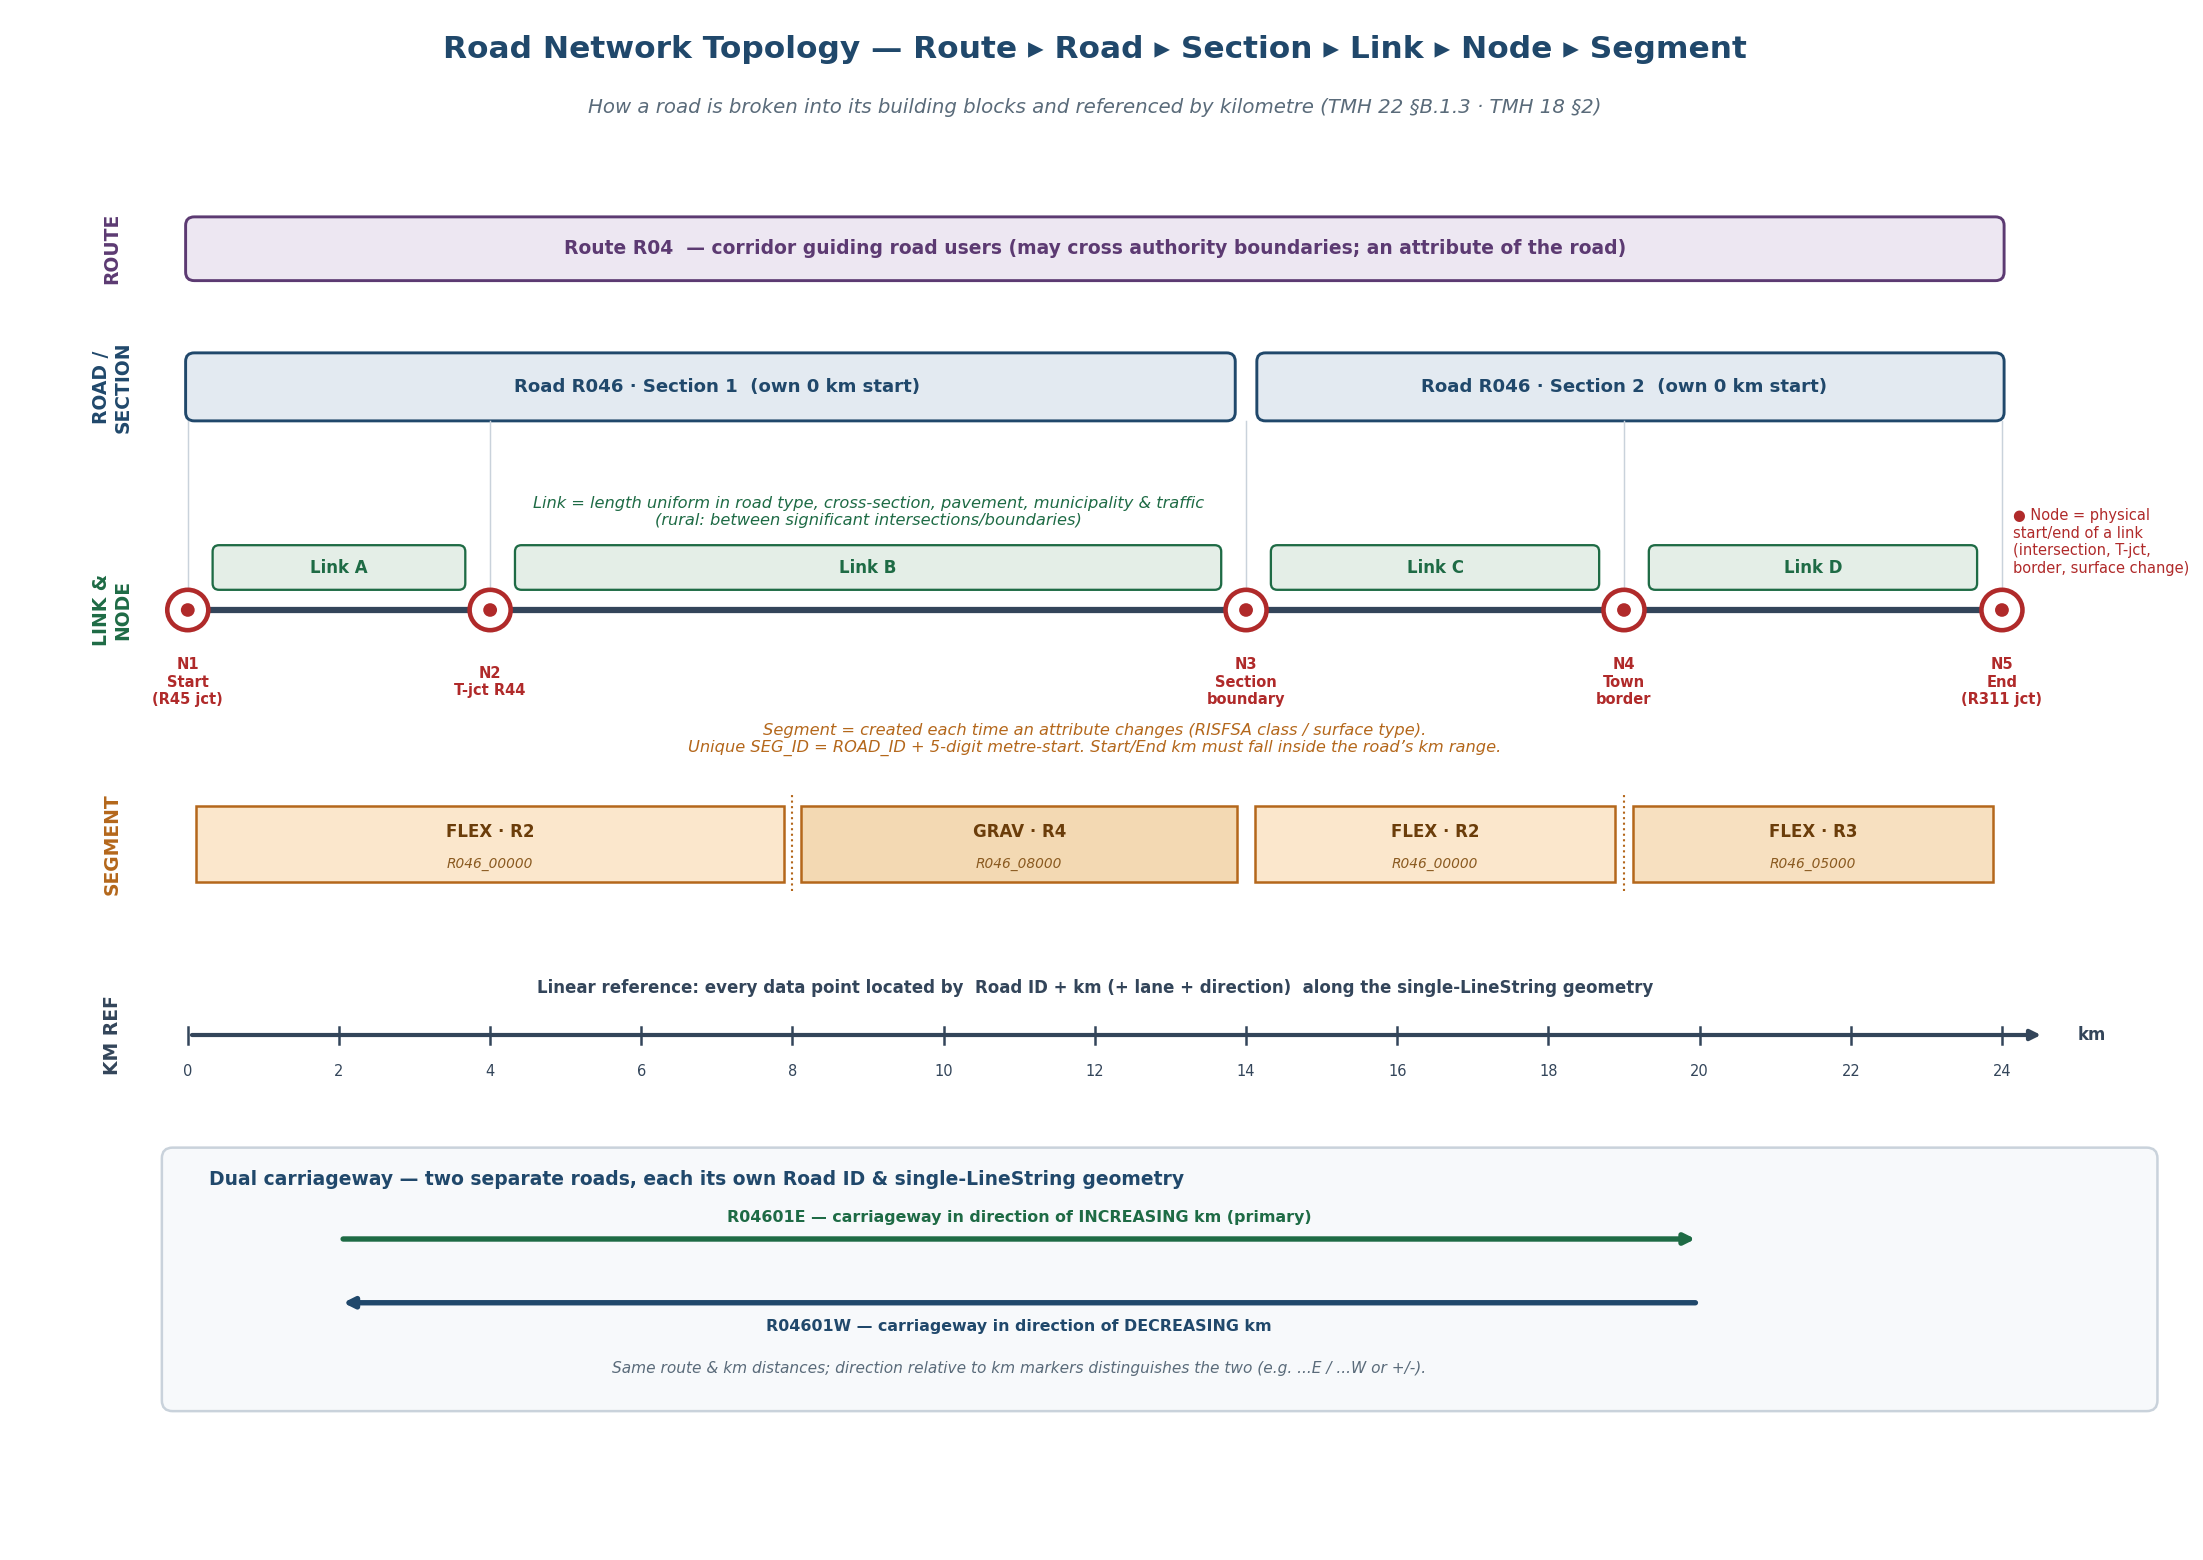
- Route — signed corridor; an attribute of the road.
- Road — base unit, unique Road ID, single-LineString geometry.
- Section — administrative subdivision, own 0 km.
- Link — uniform length, node-to-node.
- Node — physical start/end of a link.
- Segment — cut wherever an attribute changes.
1.3 · Network Creation Process
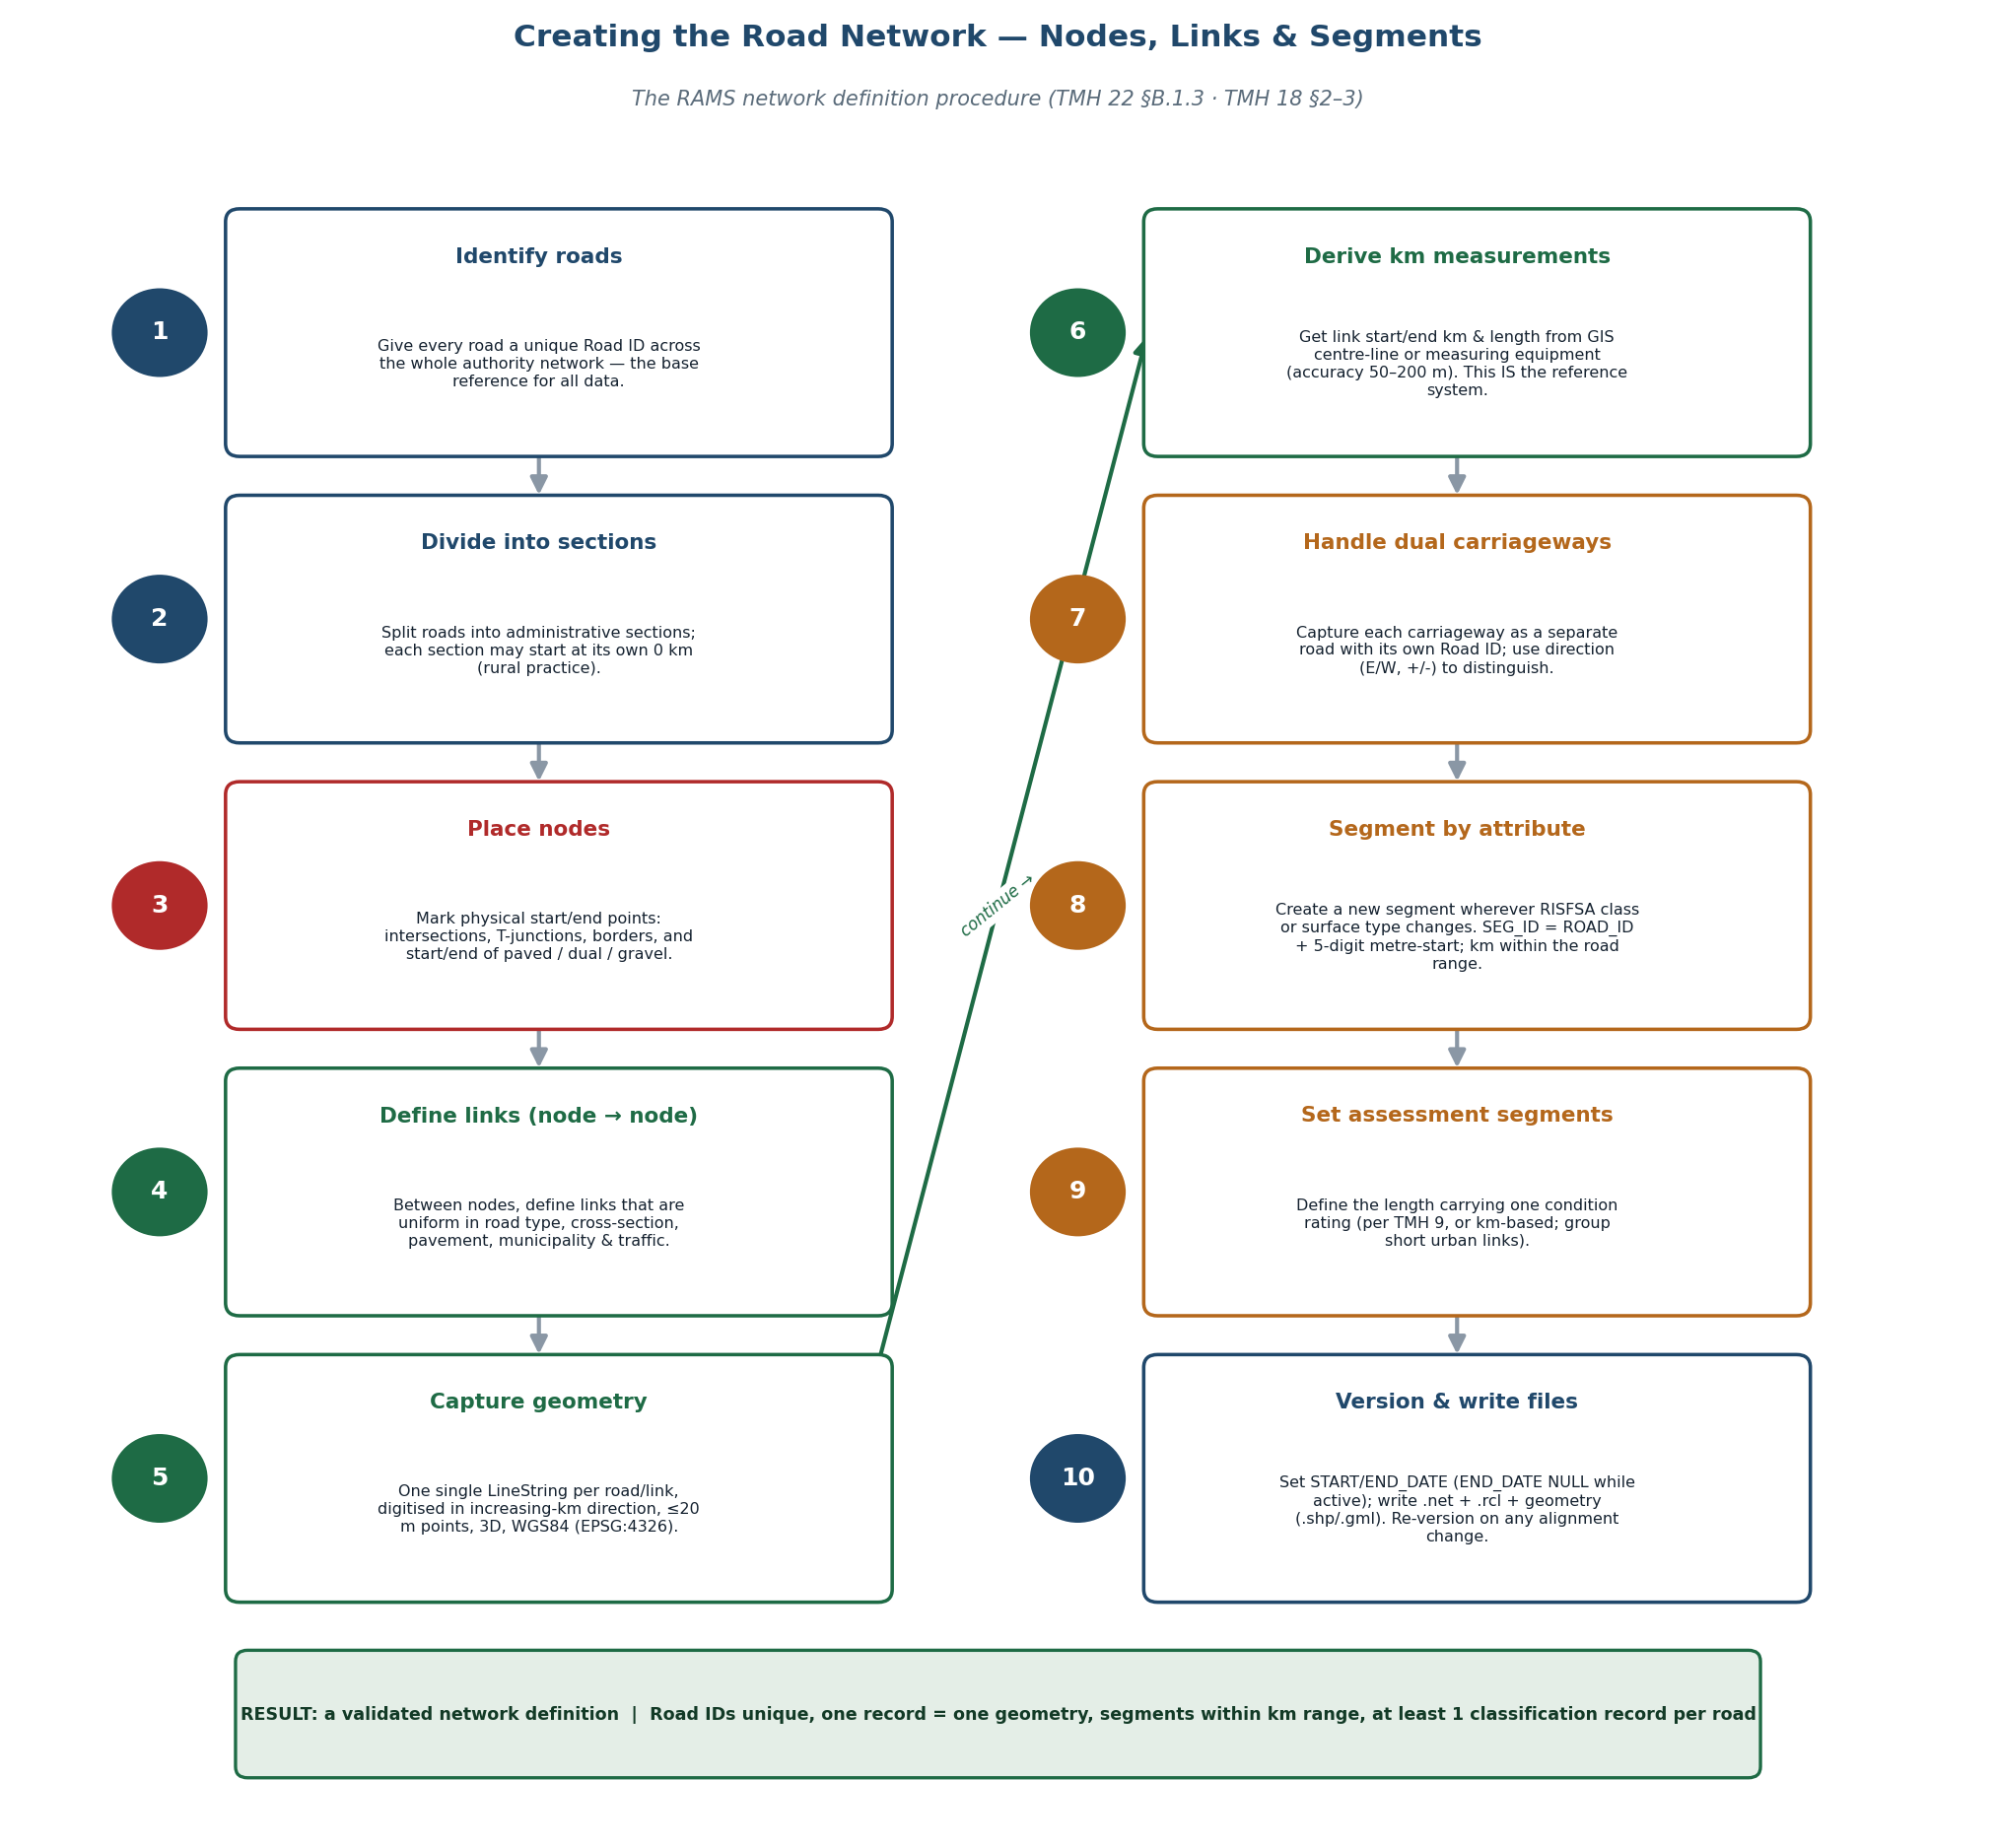
The RAMS network-definition procedure — ten steps from identifying roads to writing the versioned files. Click any step for details.
1.4 · TMH 18 Link & Segment Naming
A link is a Network Definition record keyed by ROAD_ID; a segment ID is built from that Road ID.
⬇ Download this diagram as PDF (FS_TMH18_Link_Segment_Naming.pdf)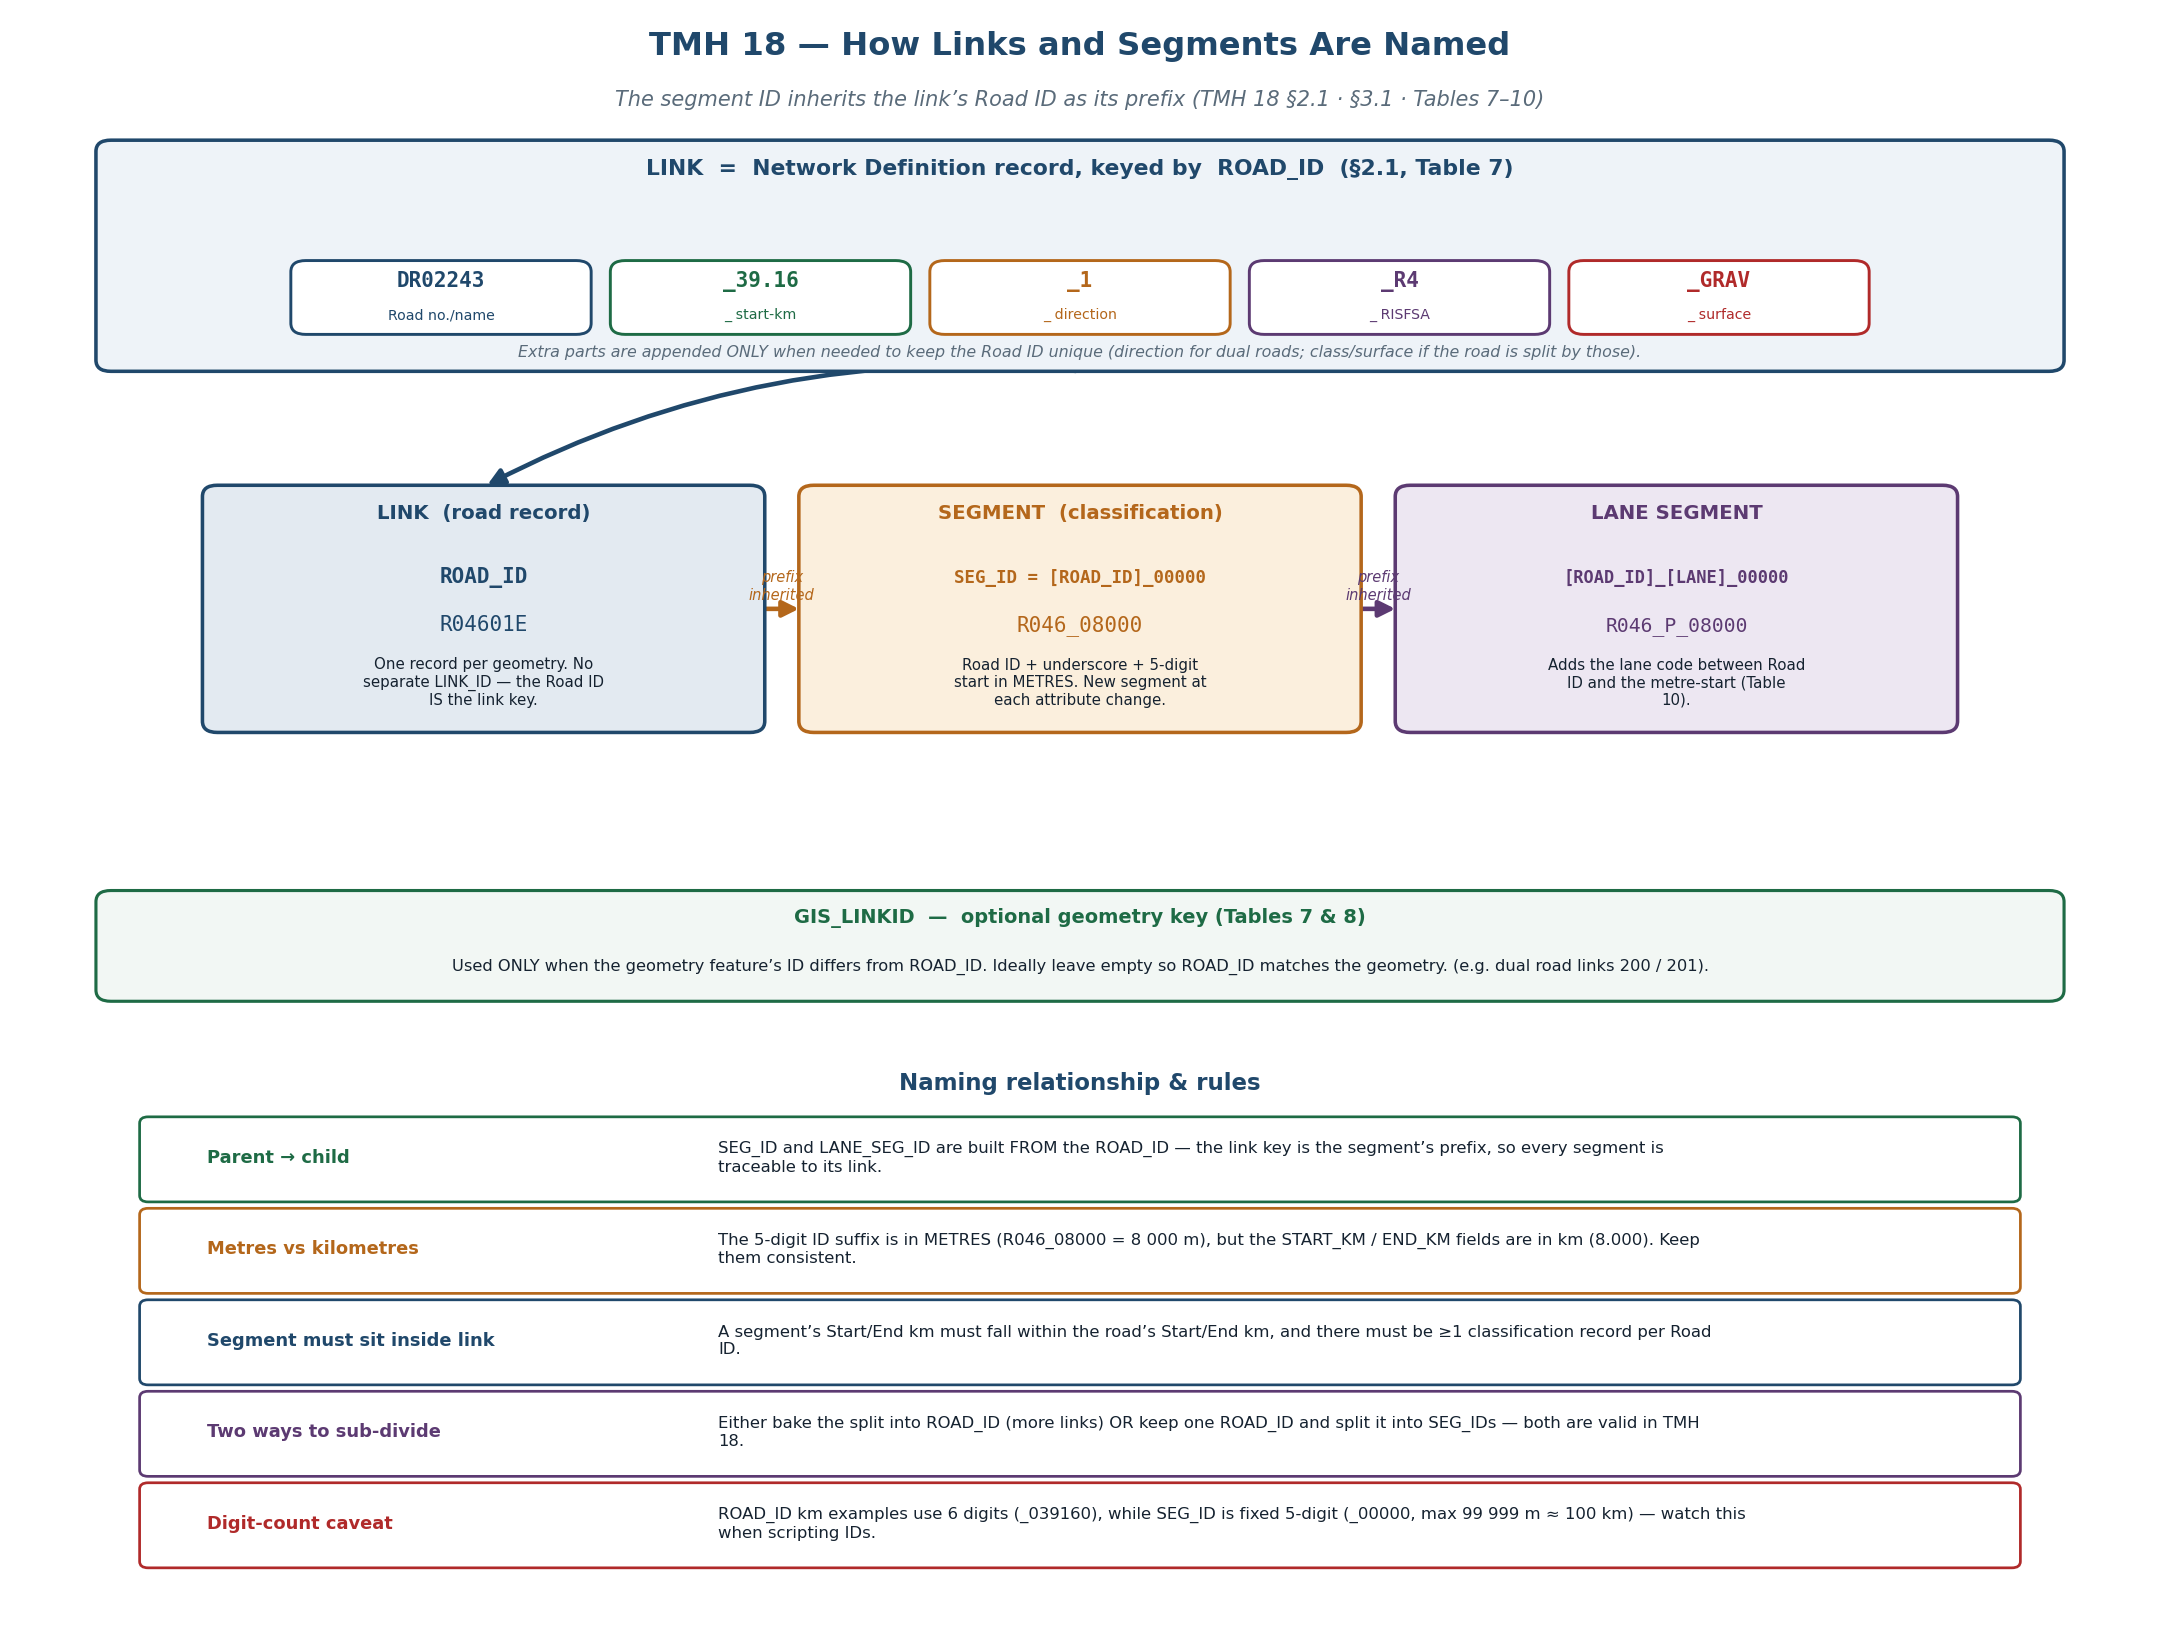
- ROAD_ID — e.g.
DR02243_39.16_1_R4_GRAV. - SEG_ID =
[ROAD_ID]_00000(5-digit metre-start). - LANE_SEG_ID =
[ROAD_ID]_[LANE]_00000. - GIS_LINKID — optional geometry key.
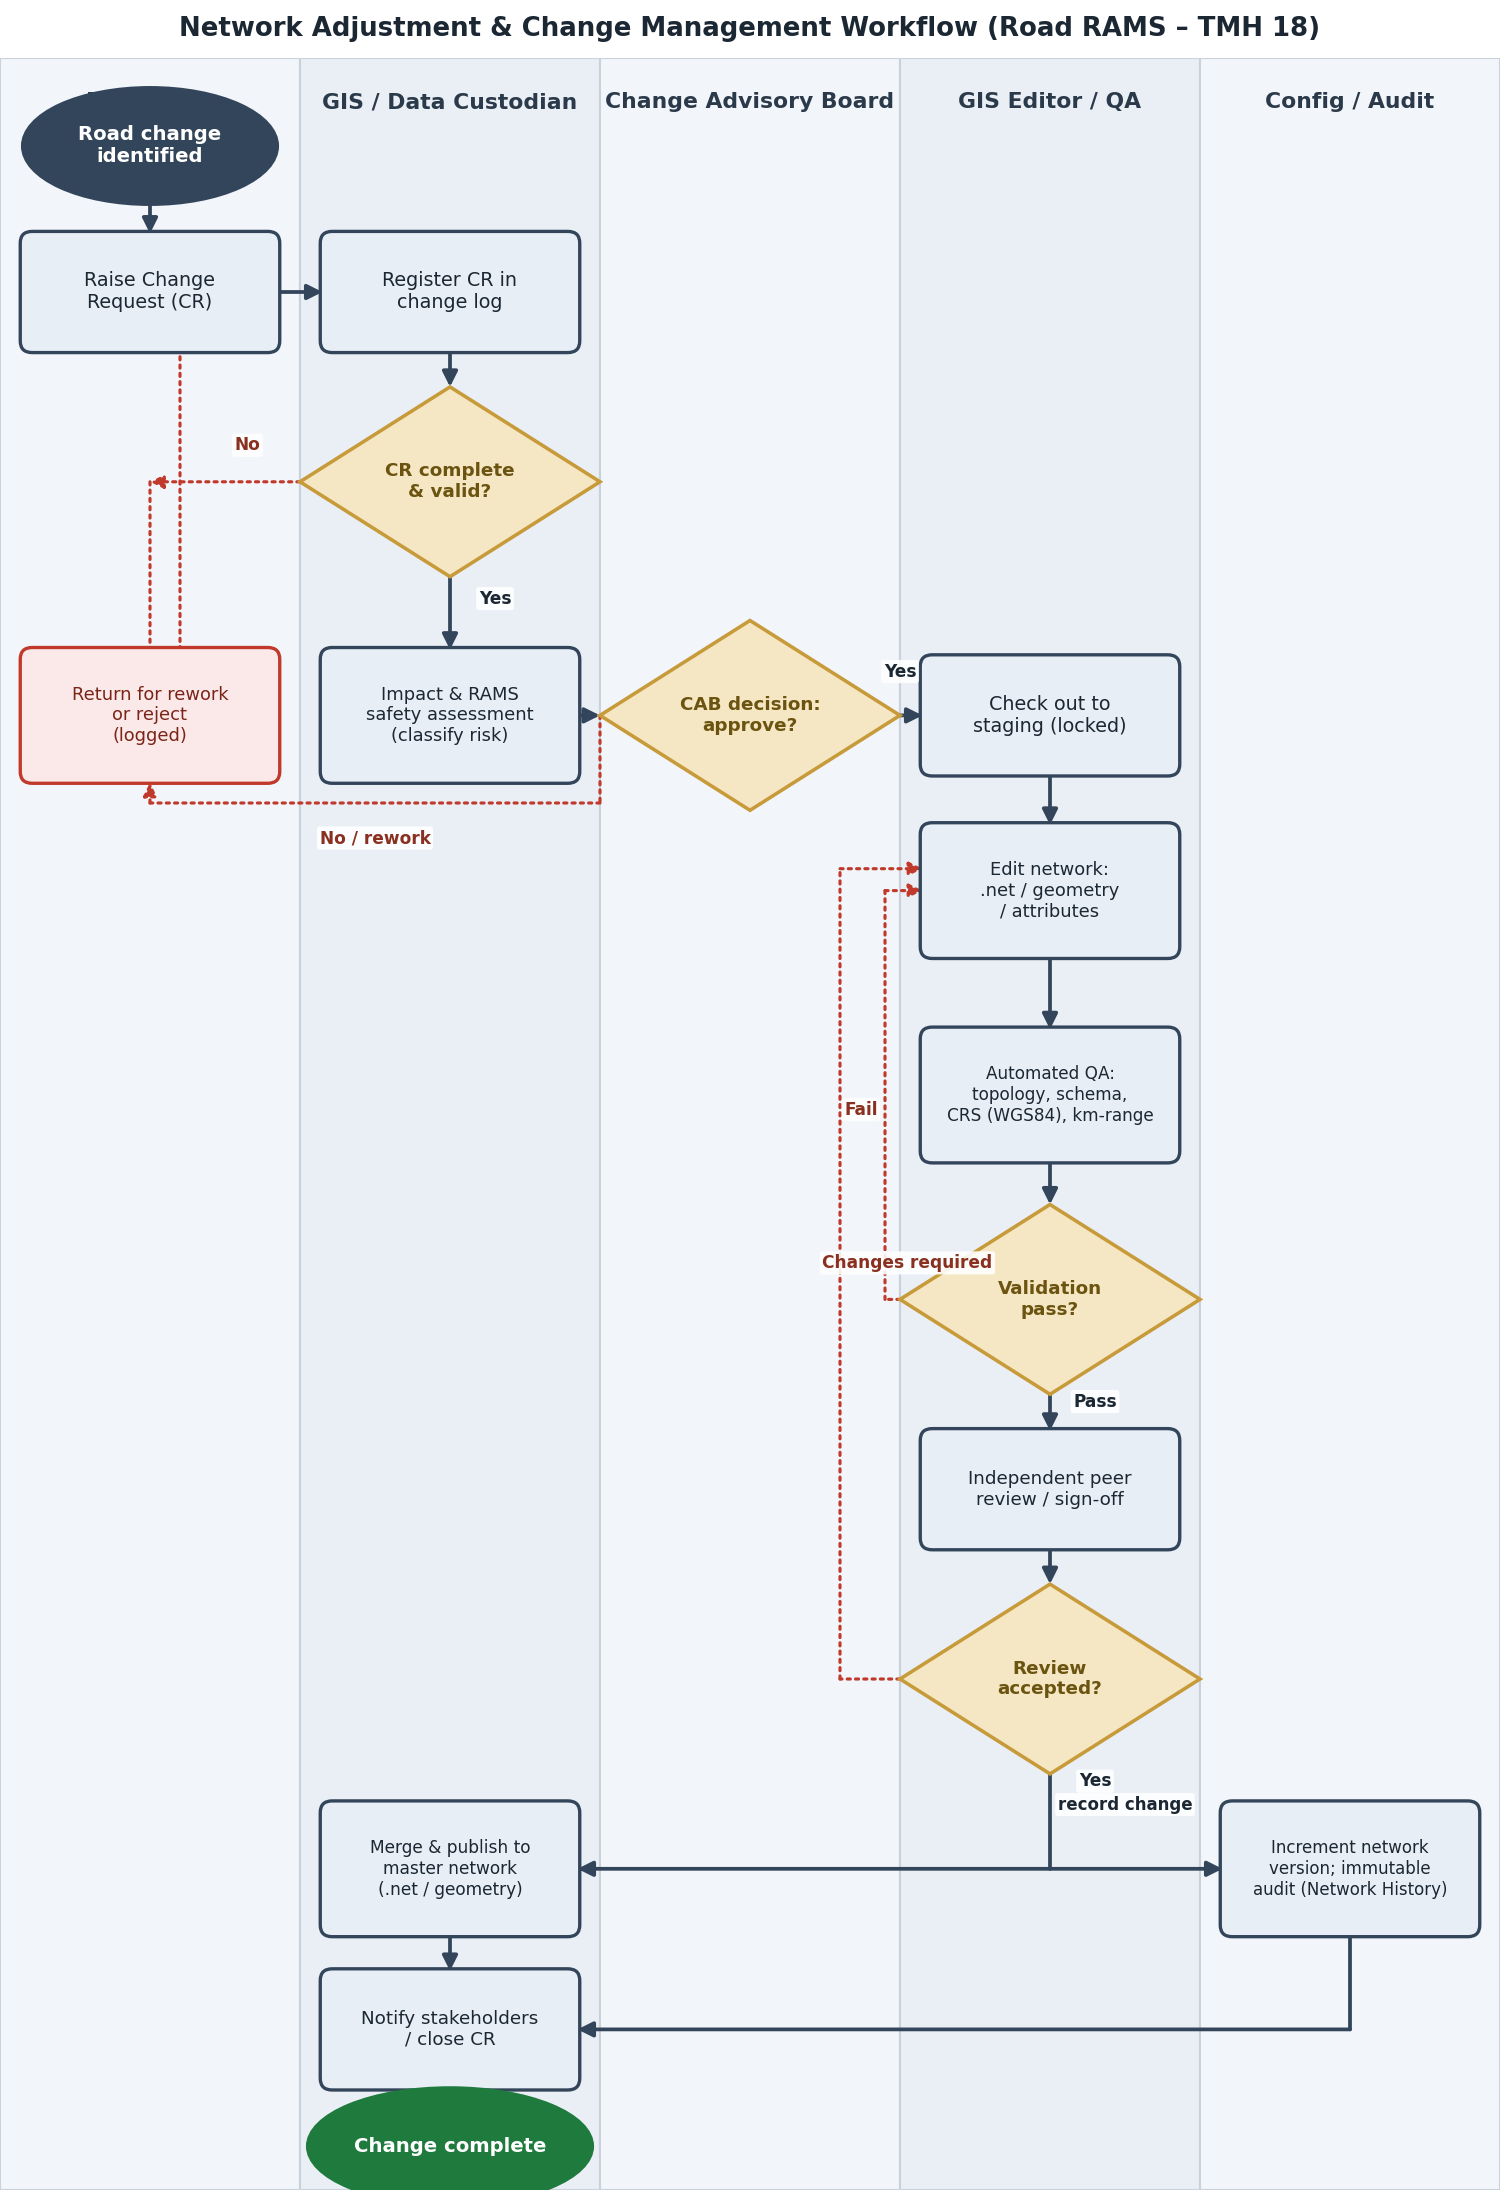
1.5 · Change Management — Road
Controlled change process for network / GIS adjustments. Click any block for details.
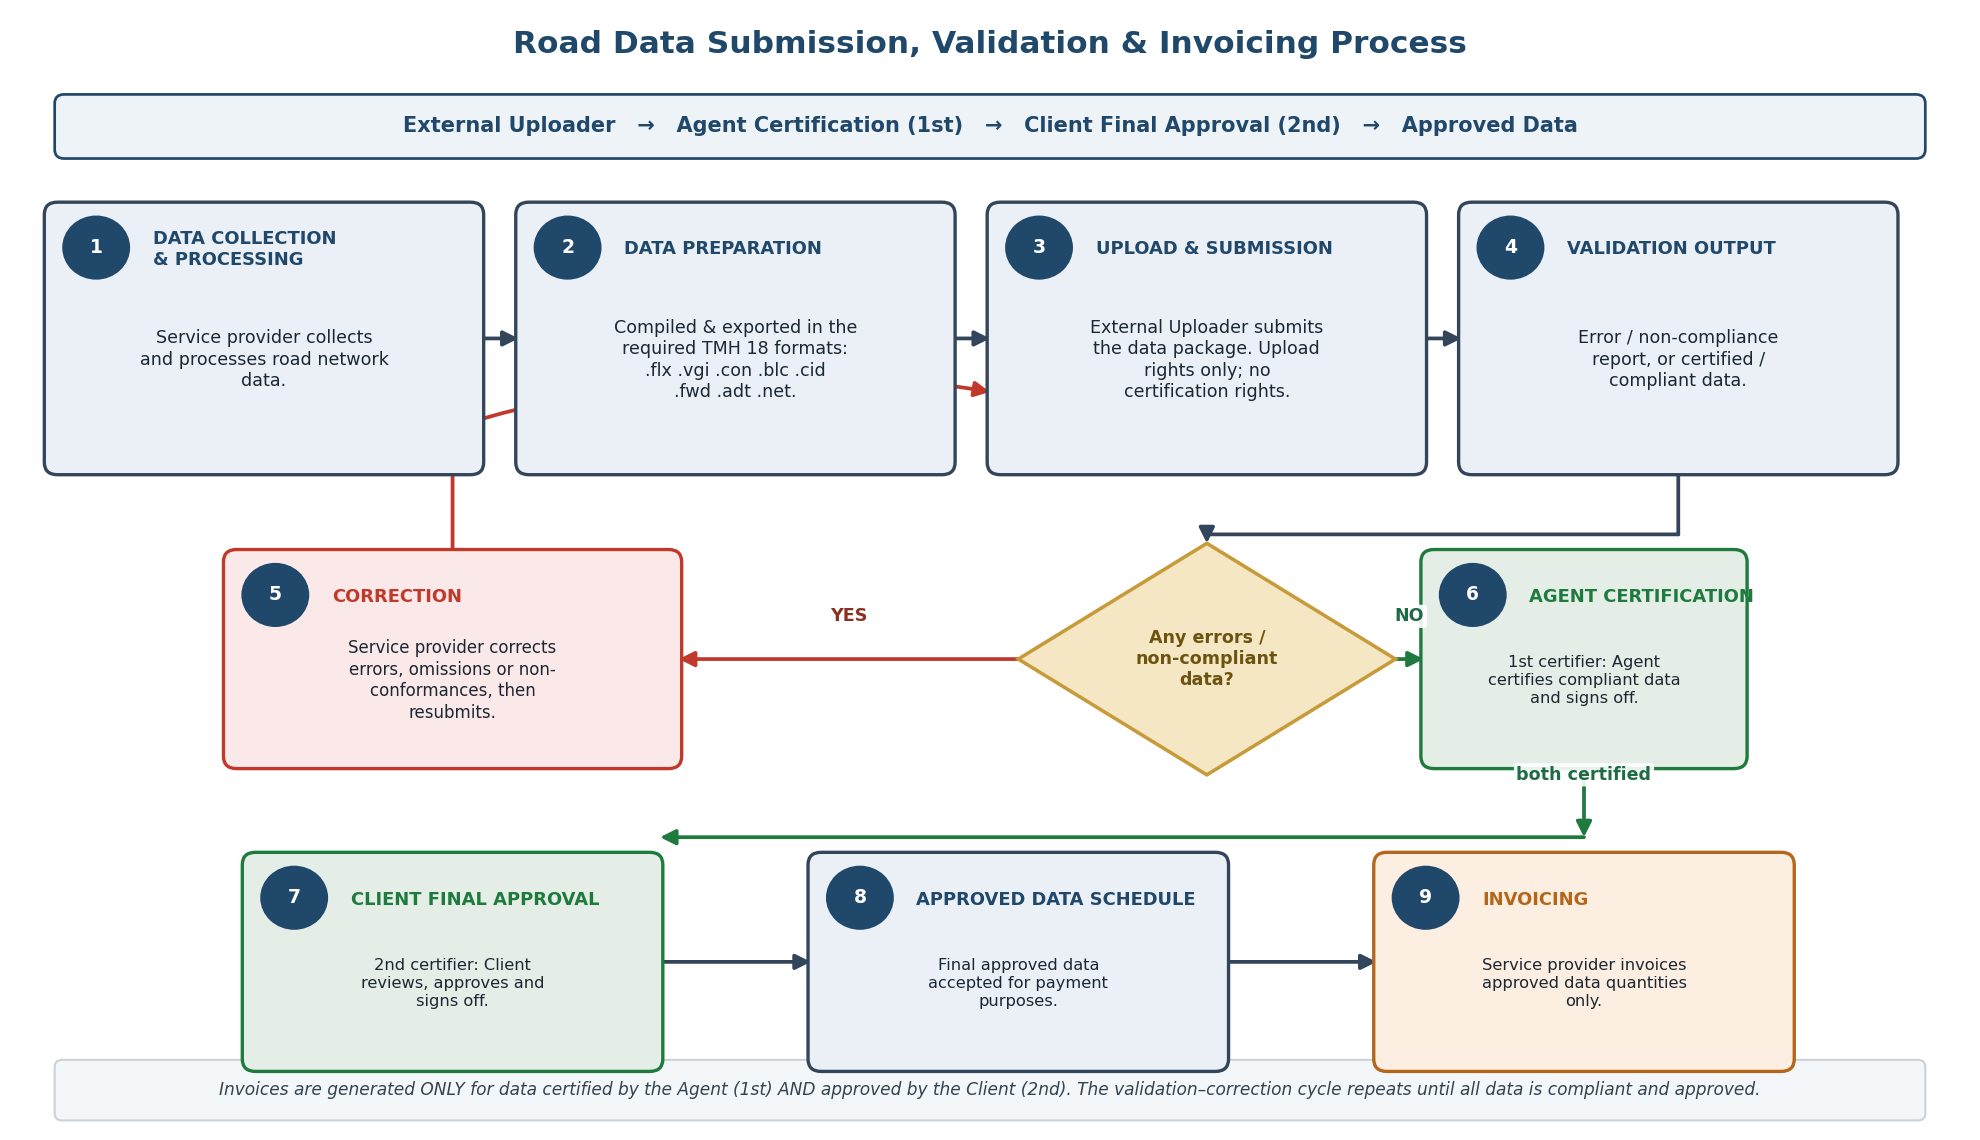
2.4 · Data Submission, Validation & Invoicing
Road data submission, validation and invoicing — external upload, two-tier certification (Agent then Client), and payment only for certified & approved data. Click any block for details.
FS RAMS — Process Sequence & Feedback Map
What needs to happen when — the seven numbered steps of the FS RAMS cycle with their timing, sequence interlinks and feedback loops. This is the umbrella map that ties the individual process flows (TRH 26, TMH 18, TMH 14) together.
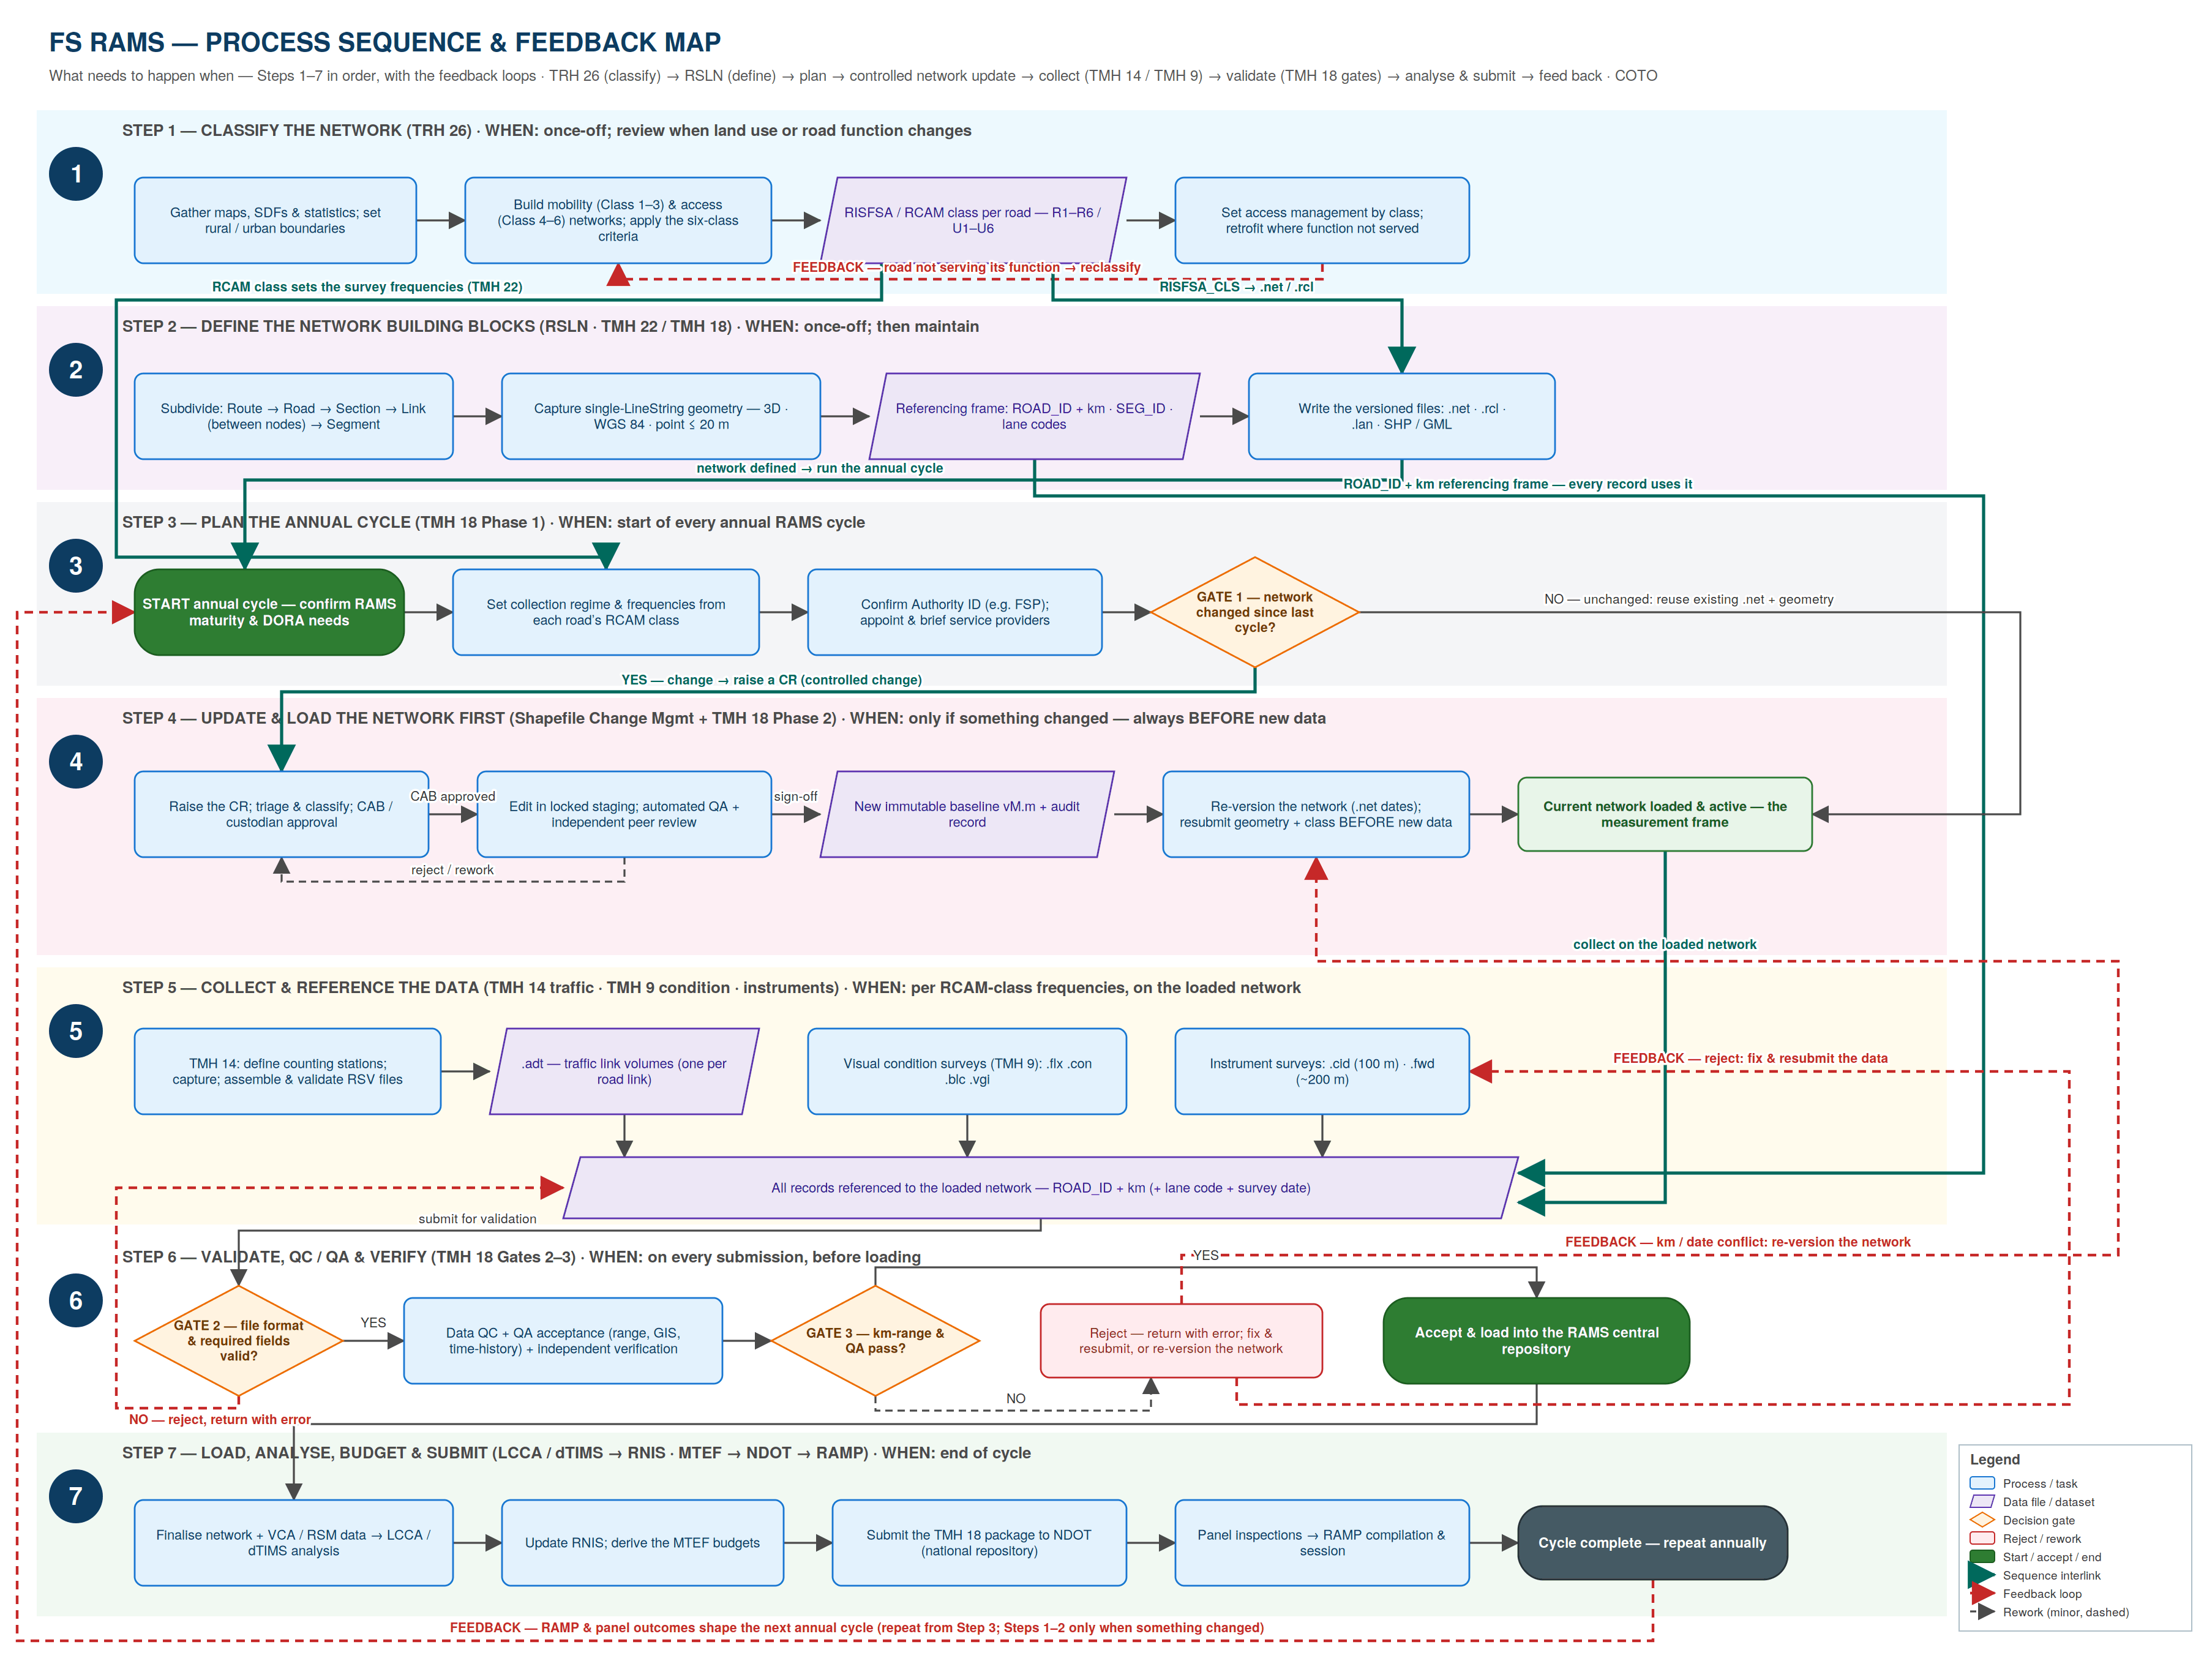
- Step 1 — Classify the network (TRH 26) — once-off; review when land use or road function changes. RISFSA / RCAM class per road (R1–R6 / U1–U6) sets access management and the survey frequencies.
- Step 2 — Define the network building blocks (RSLN · TMH 22 / TMH 18) — once-off, then maintain. Route ▸ Road ▸ Section ▸ Link ▸ Segment; ROAD_ID + km is the referencing frame every record uses.
- Step 3 — Plan the annual cycle (TMH 18 Phase 1) — start of every cycle: confirm RAMS maturity & DORA needs, set frequencies from each road's RCAM class, confirm Authority ID; Gate 1 asks whether the network changed.
- Step 4 — Update & load the network first — only if something changed, always before new data: CR ▸ CAB approval ▸ locked staging ▸ new immutable baseline ▸ re-versioned network loaded & active.
- Step 5 — Collect & reference the data — TMH 14 traffic, TMH 9 visual condition and instrument surveys, per RCAM-class frequencies, on the loaded network.
- Step 6 — Validate, QC / QA & verify — TMH 18 Gates 2–3 on every submission before loading into the RAMS central repository.
- Step 7 — Load, analyse, budget & submit — LCCA / dTIMS ▸ RNIS ▸ MTEF budgets ▸ TMH 18 package to NDOT ▸ panel inspections ▸ RAMP.
- Feedback loops (dashed red) — road not serving its function → reclassify; gate rejects → fix & resubmit; km / date conflict → re-version the network; RAMP & panel outcomes shape the next annual cycle (repeat from Step 3).
1.1 · TRH 26 — Road Classification & Access Management
Functional six-class classification plus access management (TRH 26, COTO Aug 2012) — the once-off Step 1 of the RAMS cycle, feeding the RISFSA / RCAM class into the TMH 18 data files.
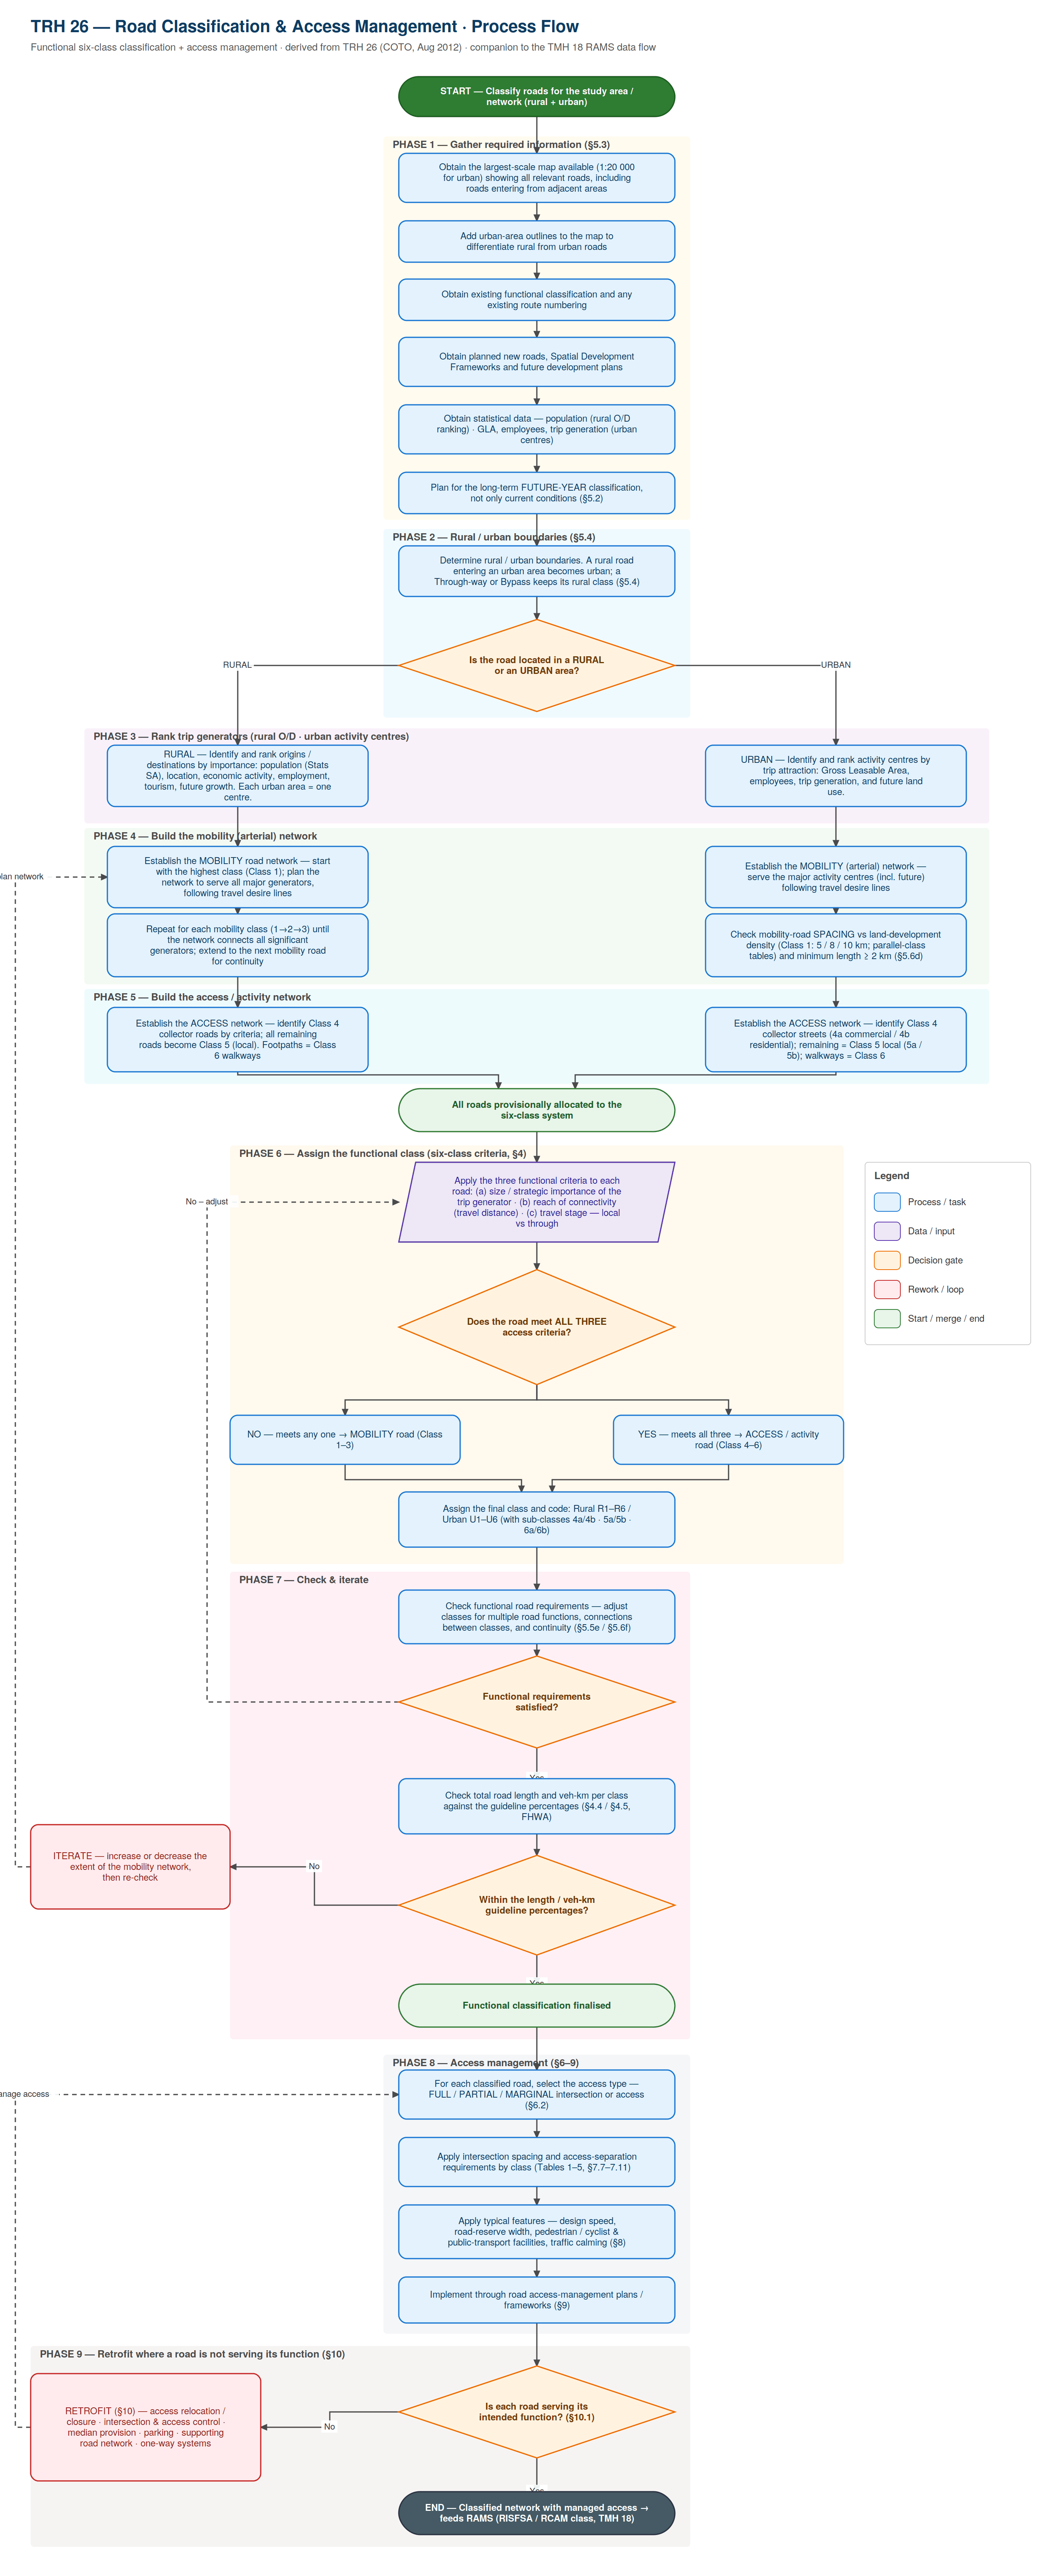
- Phases 1–2 — gather maps, SDFs and statistics; set rural / urban boundaries (a rural road entering an urban area becomes urban).
- Phases 3–5 — rank trip generators, build the mobility (arterial) network per class, then the access / activity network.
- Phase 6 — assign the final class: meets all three access criteria → Access road (Class 4–6), otherwise Mobility road (Class 1–3); code as Rural R1–R6 / Urban U1–U6.
- Phase 7 — check functional requirements and length / veh-km guideline percentages; iterate the mobility network extent if needed.
- Phases 8–9 — apply access type, intersection spacing and typical features per class; retrofit (§10) where a road is not serving its function.
2.2 · TMH 18 — Creating & Updating the RAMS Data & GIS Datasets
Single combined end-to-end flow (TMH 18 · TMH 22 · TRH 26) for the annual RAMS data cycle — five phases, three decision gates.
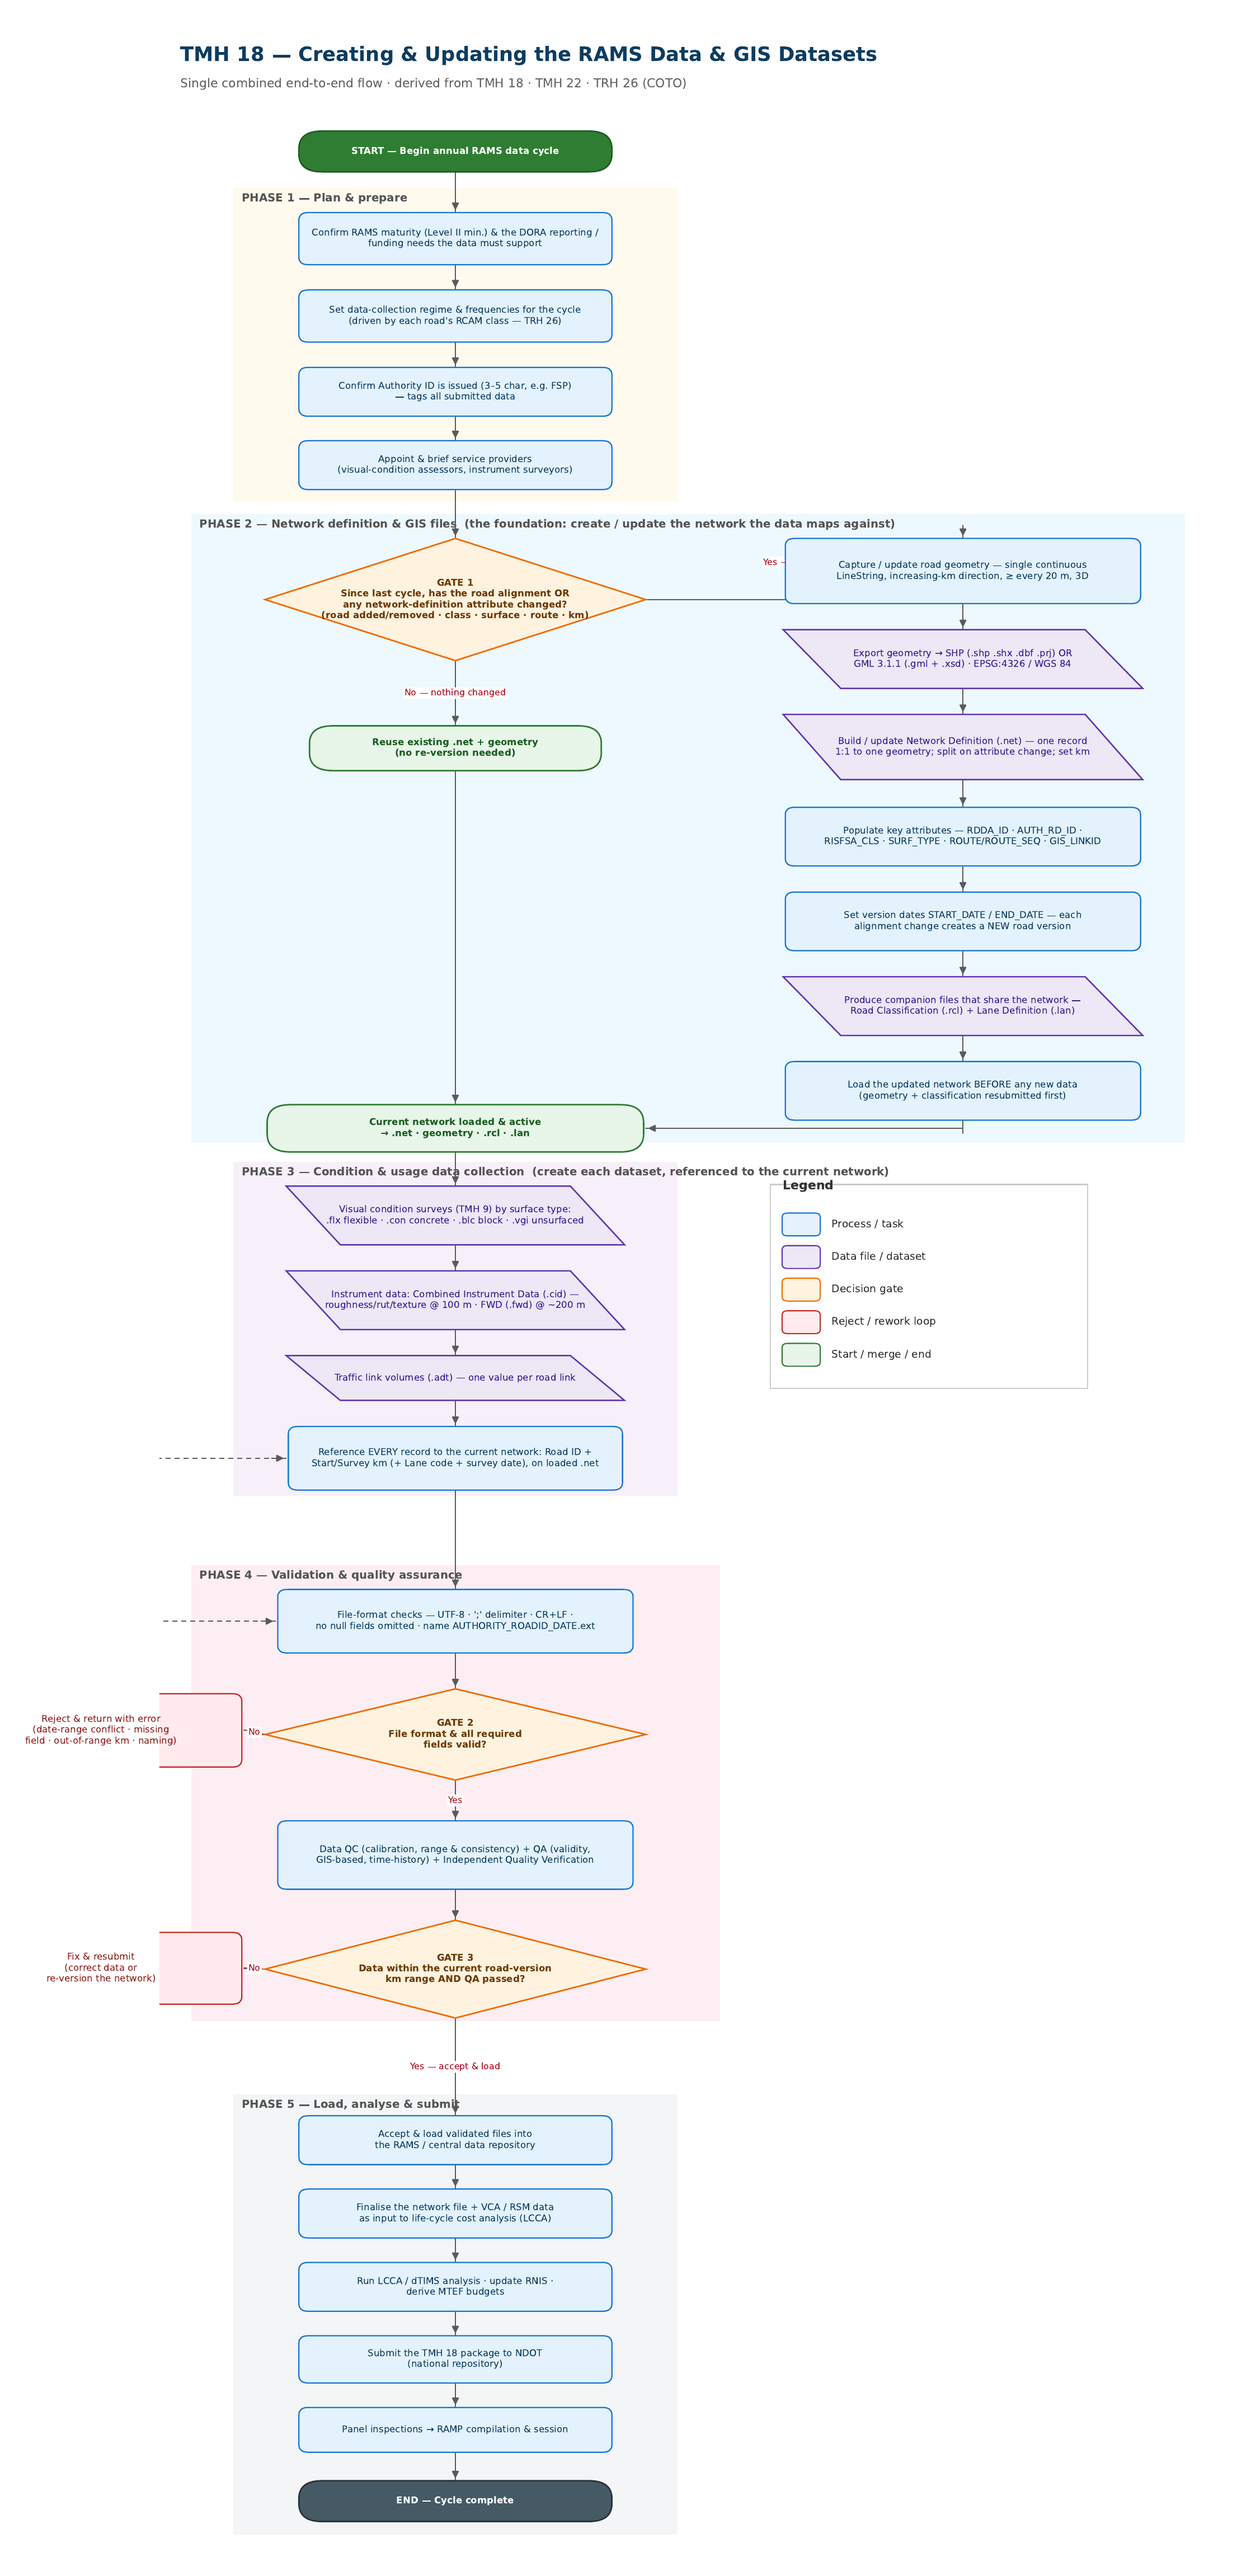
- Phase 1 — Plan & prepare — confirm RAMS maturity & DORA needs; set frequencies from RCAM class; confirm Authority ID; appoint service providers.
- Phase 2 — Network definition & GIS files — Gate 1: if alignment or attributes changed, capture geometry (single LineString, ≥ every 20 m, 3D), export SHP / GML (EPSG:4326), rebuild .net with version dates, produce .rcl / .lan — and load the network before any new data.
- Phase 3 — Condition & usage data — TMH 9 visual surveys (.flx .con .blc .vgi), instrument data (.cid / .fwd), traffic volumes (.adt); every record referenced to ROAD_ID + km on the loaded network.
- Phase 4 — Validation & QA — Gate 2 file format & required fields; Gate 3 km-range within the current road version + QC / QA passed.
- Phase 5 — Load, analyse & submit — load to the RAMS repository, LCCA / dTIMS ▸ RNIS ▸ MTEF, submit the TMH 18 package to NDOT, panel inspections ▸ RAMP.
2.3 · TMH 14 — Automatic Traffic Data Collection & Submission
End-to-end flow to produce a compliant Standard Traffic Data file (TMH 14, COTO Version 3.00, 2013) — the traffic leg of Step 5 in the RAMS cycle.
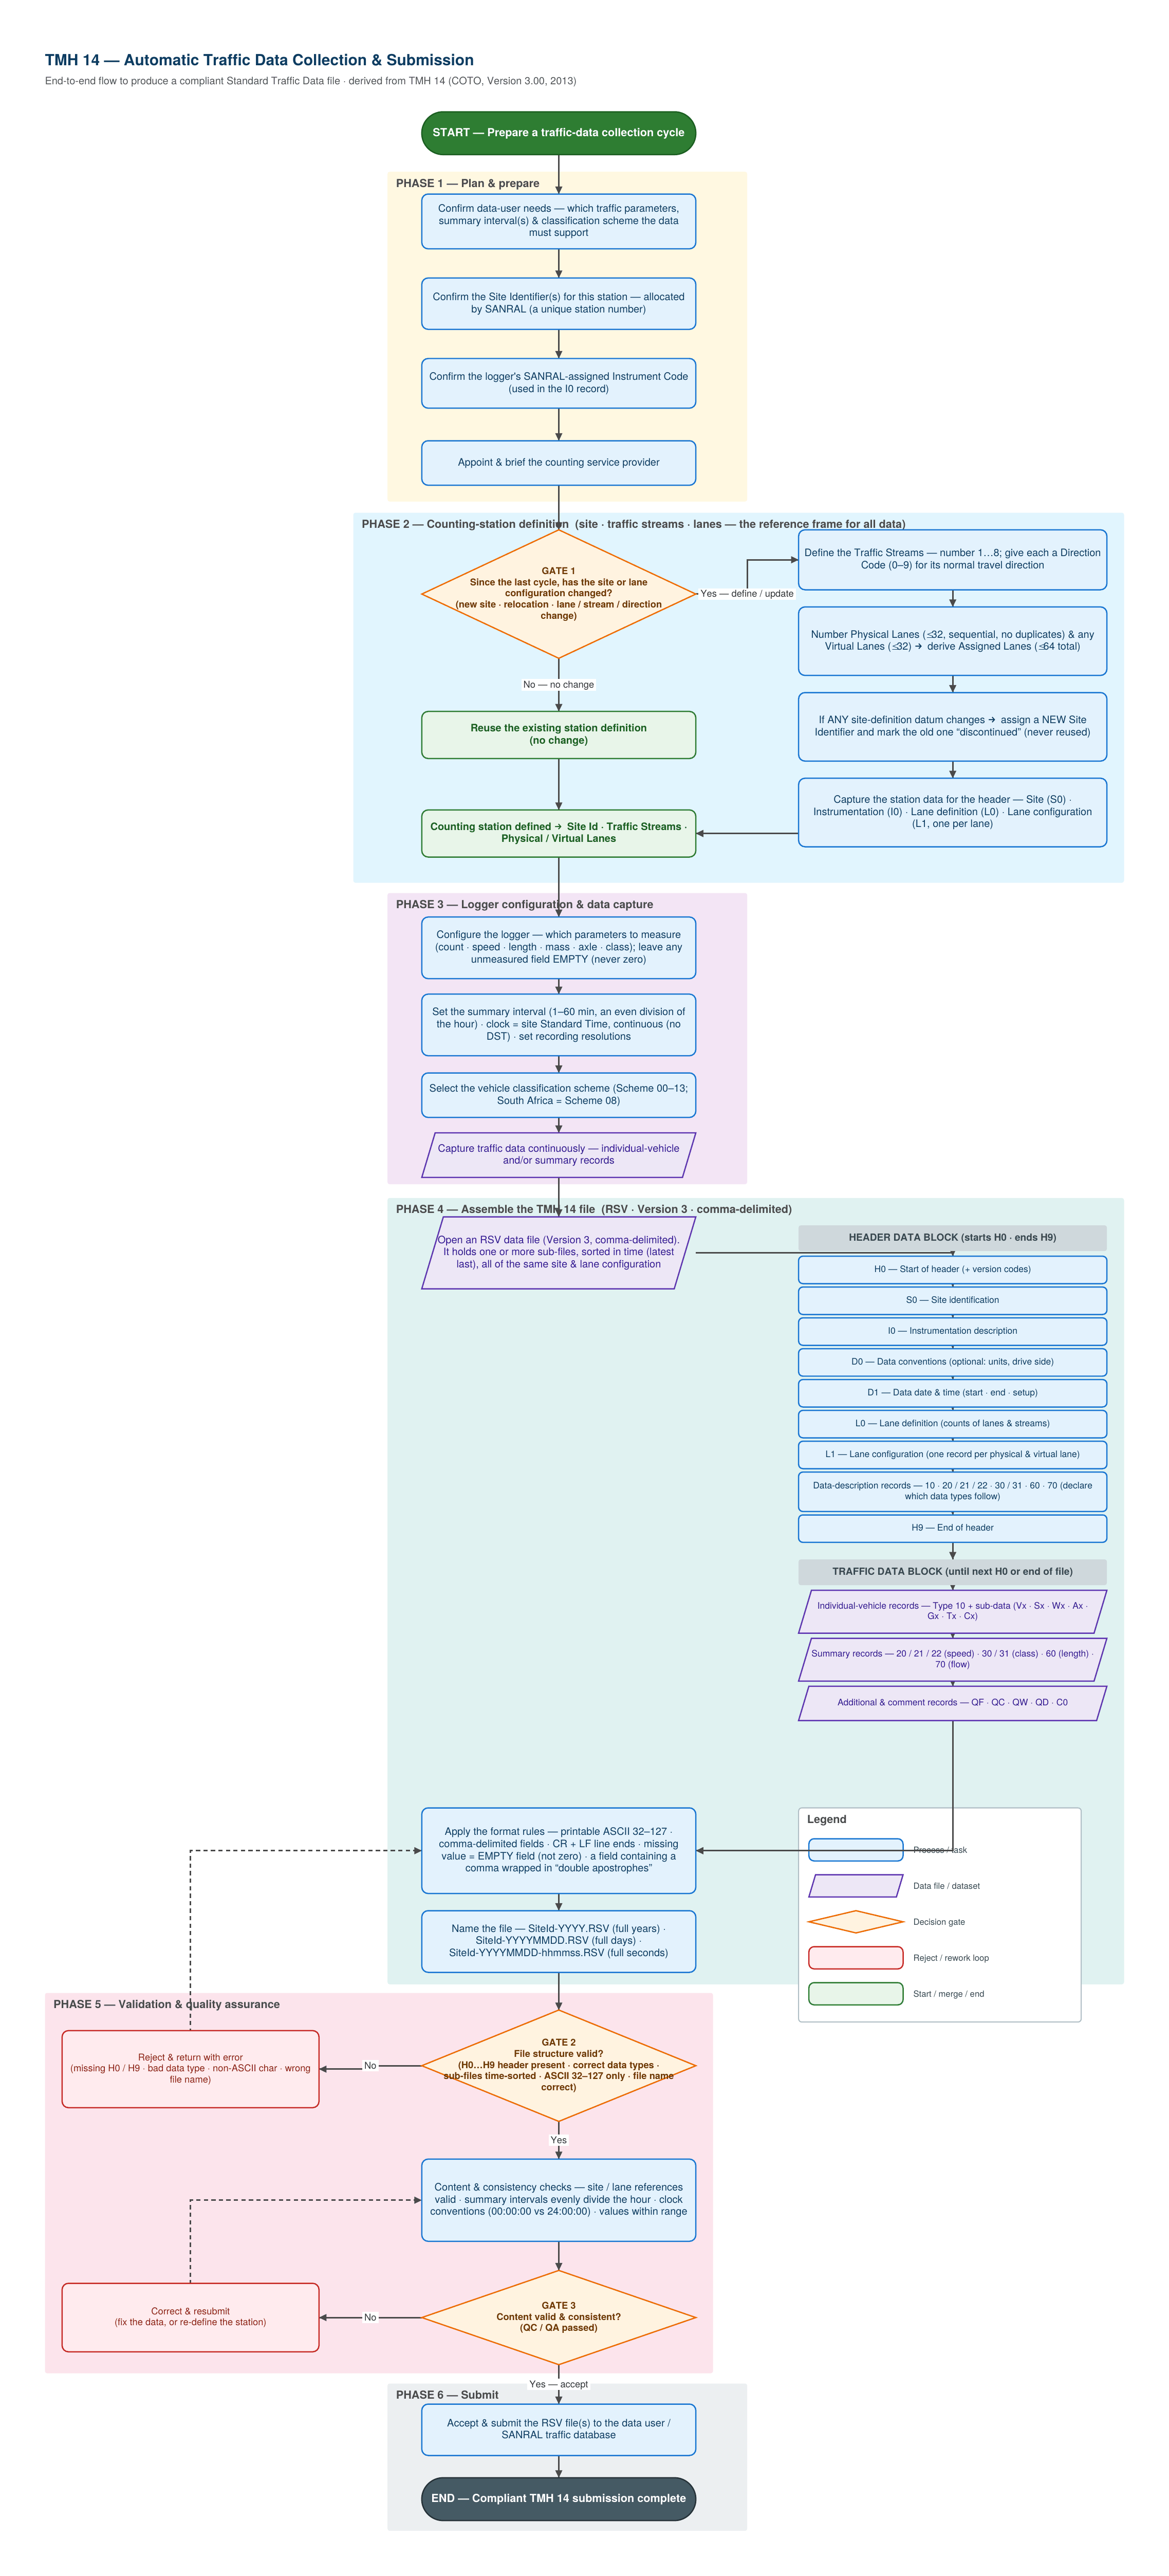
- Phase 1 — Plan & prepare — confirm data-user needs, Site Identifiers and SANRAL-assigned Instrument Codes; appoint the counting service provider.
- Phase 2 — Counting-station definition — Gate 1: if site or lane configuration changed, redefine traffic streams (1…8, direction codes 0–9), number physical (≤32) and virtual (≤32) lanes; a changed site-definition datum means a new Site Identifier.
- Phase 3 — Logger configuration — parameters to measure, summary interval 1–60 min (even division of the hour), site Standard Time (no DST), classification scheme (South Africa = Scheme 08).
- Phase 4 — Assemble the RSV file — Version 3 comma-delimited: header block H0…H9 (S0 · I0 · D0 · D1 · L0 · L1 · data-description records), then individual-vehicle and/or summary records; name as SiteId-YYYY / -YYYYMMDD / -YYYYMMDD-hhmmss.RSV.
- Phase 5 — Validation & QA — Gate 2 file structure; Gate 3 content & consistency (site / lane references, intervals, clock conventions, value ranges).
- Phase 6 — Submit — accept & submit the RSV file(s) to the data user / SANRAL traffic database.
3.1 · Condition, Functional & Composite Indices (TMH 22 Part E)
The index framework TMH 22 prescribes for turning raw survey data into comparable scores — computed in WBS element 10.7, compared against national minimum standards in 10.8, and carried into the condition reports and RAMP. All references verified in TMH 22 (Draft, March 2013).
- VCI — Visual Condition Index from TMH 9 degree/extent ratings; the headline paved-network score.
- Component condition indices for unbundling: CIFPAVE (flexible), CICPAVE (concrete), CIBPAVE (block) and CISURF (surfacing).
- CIUNPAVED — gravel-road condition from TMH 9 unpaved ratings, with CIFORM for formation.
- Roadway condition indices covering the reserve outside the pavement.
- Structure condition indices from TMH 19 inspection ratings (feeds the BMS).
- Condition indices for ancillary components (signs, markings, guardrails, drainage — WBS 3.6).
- Road capacity (E.3.2) and availability (E.3.3) — is the road big enough and open?
- Riding quality (E.3.4) — FI from IRI / roughness (FIIRI / FIROUGHNESS), from the Class-1 IRI surveys (WBS 4.4).
- User risk (E.3.5) and safety — accident record (E.3.6, FISAFETY) — this is where the accident data from WBS 8.8 lands.
- Functional index and importance factor per structure, combining condition with strategic importance.
- FICOMPOSITE — weighted bundling of the functional indices into one network score for comparison and reporting.
- Combined index per structure — condition × functional × importance — for ranking structures needs.
- Minimum condition and functional index values are set nationally and updated from time to time — trend comparison against these is WBS 10.8.
Feeds: TMH 9 visual ratings (WBS 6.0) · instrument surveys (4.0) · structures inspections (7.0) · traffic & accident data (8.0) → indices (10.7) → trends vs minimums (10.8) → situational analysis & problem statements (12.7) → RAMP (12.5).
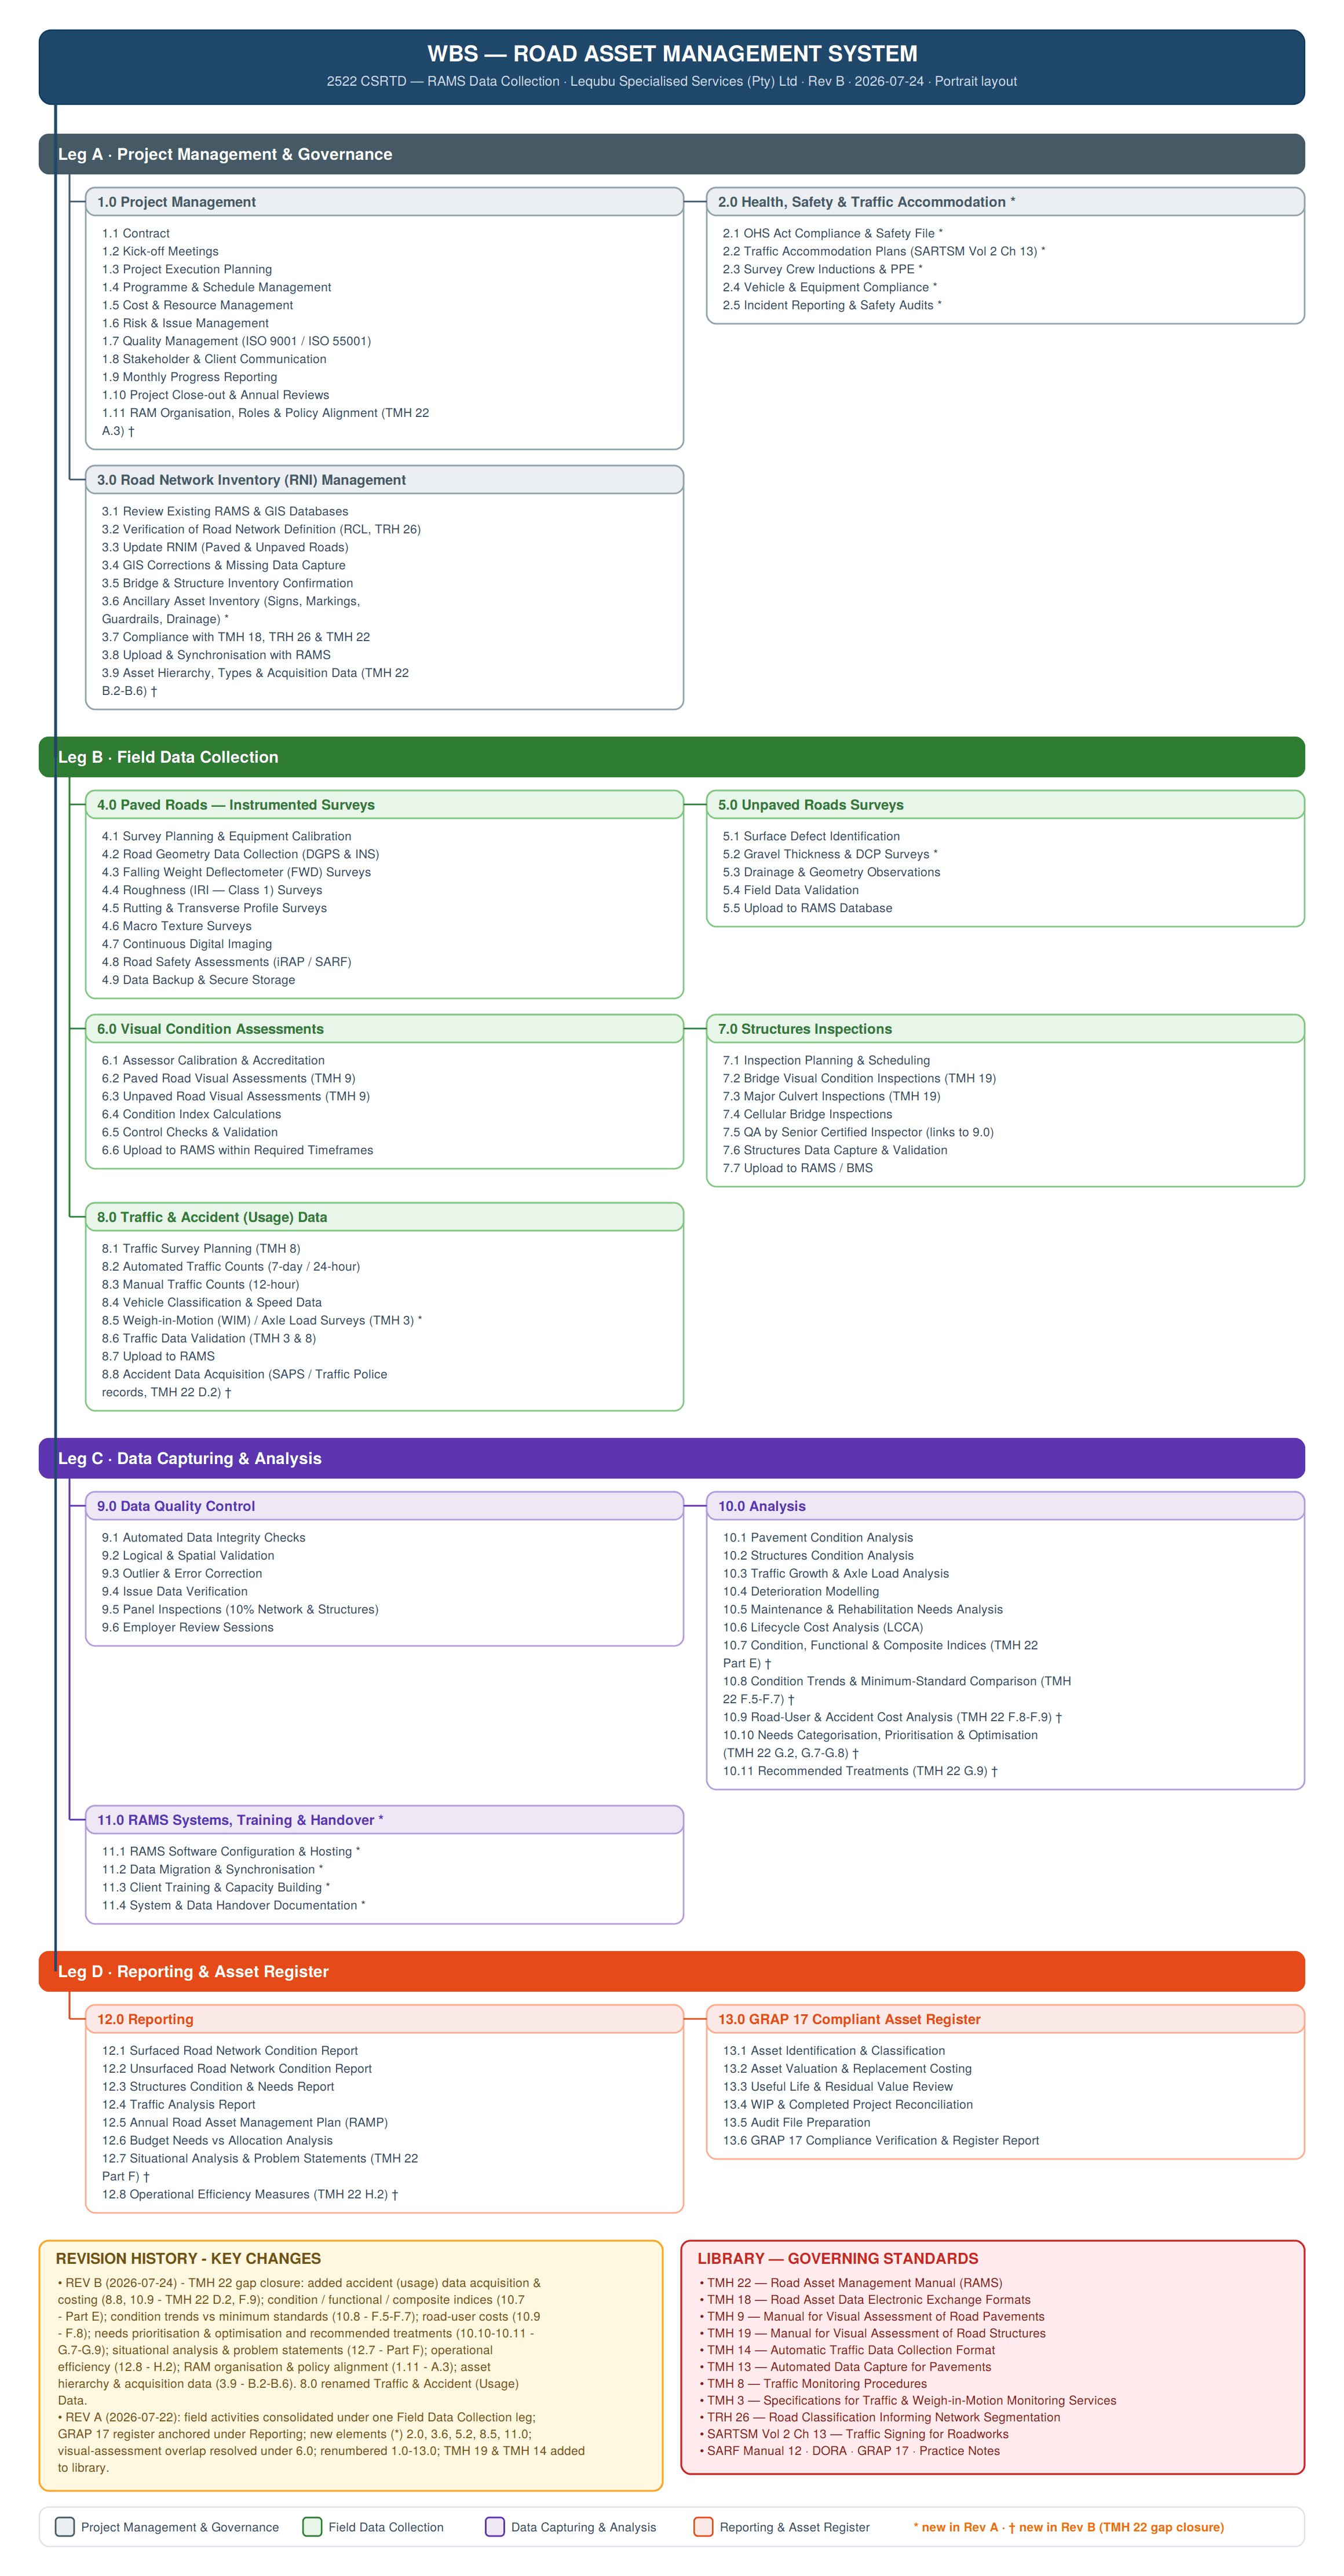
Project WBS — Rev B
Work breakdown structure for 2522 CSRTD — RAMS Data Collection: 13 elements across four legs. ★ marks Rev A additions; † Rev B marks the TMH 22 gap-closure additions (24 July 2026).
- 1.1 Contract
- 1.2 Kick-off Meetings
- 1.3 Project Execution Planning
- 1.4 Programme & Schedule Management
- 1.5 Cost & Resource Management
- 1.6 Risk & Issue Management
- 1.7 Quality Management (ISO 9001 / ISO 55001)
- 1.8 Stakeholder & Client Communication
- 1.9 Monthly Progress Reporting
- 1.10 Project Close-out & Annual Reviews
- 1.11 RAM Organisation, Roles & Policy Alignment (TMH 22 A.3)†
- 2.1 OHS Act Compliance & Safety File
- 2.2 Traffic Accommodation Plans (SARTSM Vol 2 Ch 13)
- 2.3 Survey Crew Inductions & PPE
- 2.4 Vehicle & Equipment Compliance
- 2.5 Incident Reporting & Safety Audits
- 3.1 Review Existing RAMS & GIS Databases
- 3.2 Verification of Road Network Definition (RCL, TRH 26)
- 3.3 Update RNIM (Paved & Unpaved Roads)
- 3.4 GIS Corrections & Missing Data Capture
- 3.5 Bridge & Structure Inventory Confirmation
- 3.6 Ancillary Asset Inventory (Signs, Markings, Guardrails, Drainage)★
- 3.7 Compliance with TMH 18, TRH 26 & TMH 22
- 3.8 Upload & Synchronisation with RAMS
- 3.9 Asset Hierarchy, Types & Acquisition Data (TMH 22 B.2–B.6)†
- 4.1 Survey Planning & Equipment Calibration
- 4.2 Road Geometry Data Collection (DGPS & INS)
- 4.3 Falling Weight Deflectometer (FWD) Surveys
- 4.4 Roughness (IRI — Class 1) Surveys
- 4.5 Rutting & Transverse Profile Surveys
- 4.6 Macro Texture Surveys
- 4.7 Continuous Digital Imaging
- 4.8 Road Safety Assessments (iRAP / SARF)
- 4.9 Data Backup & Secure Storage
- 5.1 Surface Defect Identification
- 5.2 Gravel Thickness & DCP Surveys★
- 5.3 Drainage & Geometry Observations
- 5.4 Field Data Validation
- 5.5 Upload to RAMS Database
- 6.1 Assessor Calibration & Accreditation
- 6.2 Paved Road Visual Assessments (TMH 9)
- 6.3 Unpaved Road Visual Assessments (TMH 9)
- 6.4 Condition Index Calculations
- 6.5 Control Checks & Validation
- 6.6 Upload to RAMS within Required Timeframes
- 7.1 Inspection Planning & Scheduling
- 7.2 Bridge Visual Condition Inspections (TMH 19)
- 7.3 Major Culvert Inspections (TMH 19)
- 7.4 Cellular Bridge Inspections
- 7.5 QA by Senior Certified Inspector (links to 9.0)
- 7.6 Structures Data Capture & Validation
- 7.7 Upload to RAMS / BMS
- 8.1 Traffic Survey Planning (TMH 8)
- 8.2 Automated Traffic Counts (7-day / 24-hour)
- 8.3 Manual Traffic Counts (12-hour)
- 8.4 Vehicle Classification & Speed Data
- 8.5 Weigh-in-Motion (WIM) / Axle Load Surveys (TMH 3)★
- 8.6 Traffic Data Validation (TMH 3 & 8)
- 8.7 Upload to RAMS
- 8.8 Accident Data Acquisition (SAPS / Traffic Police records, TMH 22 D.2)†
- 9.1 Automated Data Integrity Checks
- 9.2 Logical & Spatial Validation
- 9.3 Outlier & Error Correction
- 9.4 Issue Data Verification
- 9.5 Panel Inspections (10% Network & Structures)
- 9.6 Employer Review Sessions
- 10.1 Pavement Condition Analysis
- 10.2 Structures Condition Analysis
- 10.3 Traffic Growth & Axle Load Analysis
- 10.4 Deterioration Modelling
- 10.5 Maintenance & Rehabilitation Needs Analysis
- 10.6 Lifecycle Cost Analysis (LCCA)
- 10.7 Condition, Functional & Composite Indices (TMH 22 Part E)†
- 10.8 Condition Trends & Minimum-Standard Comparison (TMH 22 F.5–F.7)†
- 10.9 Road-User & Accident Cost Analysis (TMH 22 F.8–F.9)†
- 10.10 Needs Categorisation, Prioritisation & Optimisation (TMH 22 G.2, G.7–G.8)†
- 10.11 Recommended Treatments (TMH 22 G.9)†
- 11.1 RAMS Software Configuration & Hosting
- 11.2 Data Migration & Synchronisation
- 11.3 Client Training & Capacity Building
- 11.4 System & Data Handover Documentation
- 12.1 Surfaced Road Network Condition Report
- 12.2 Unsurfaced Road Network Condition Report
- 12.3 Structures Condition & Needs Report
- 12.4 Traffic Analysis Report
- 12.5 Annual Road Asset Management Plan (RAMP)
- 12.6 Budget Needs vs Allocation Analysis
- 12.7 Situational Analysis & Problem Statements (TMH 22 Part F)†
- 12.8 Operational Efficiency Measures (TMH 22 H.2)†
- 13.1 Asset Identification & Classification
- 13.2 Asset Valuation & Replacement Costing
- 13.3 Useful Life & Residual Value Review
- 13.4 WIP & Completed Project Reconciliation
- 13.5 Audit File Preparation
- 13.6 GRAP 17 Compliance Verification & Register Report
Rev B — key changes (24 Jul 2026, TMH 22 gap closure)
Accident (usage) data acquisition & costing (8.8, 10.9 — TMH 22 D.2, F.9) · condition / functional / composite indices (10.7 — Part E) · condition trends vs minimum standards (10.8 — F.5–F.7) · road-user costs (10.9 — F.8) · needs prioritisation, optimisation & recommended treatments (10.10–10.11 — G.7–G.9) · situational analysis & problem statements (12.7 — Part F) · operational efficiency (12.8 — H.2) · RAM organisation & policy alignment (1.11 — A.3) · asset hierarchy & acquisition data (3.9 — B.2–B.6) · 8.0 renamed Traffic & Accident (Usage) Data.Rev A — key changes
All field activities consolidated under one Field Data Collection leg (Structures, Traffic & Visual Assessments moved out of Data Capturing & Analysis) · GRAP 17 Asset Register anchored under Reporting & Asset Register (was unattached) · new elements (★): 2.0 H&S & Traffic Accommodation, 3.6 Ancillary Asset Inventory, 5.2 Gravel Thickness & DCP, 8.5 WIM / Axle Load Surveys, 11.0 RAMS Systems, Training & Handover · all visual condition work resolved under 6.0 · elements renumbered 1.0–13.0 · TMH 19 & TMH 14 added to the library; unverified “TMH 24” removed.Library — governing standards
TMH 22 — RAMS ManualTMH 18 — Data Exchange FormatsTMH 9 — Visual Assessment: PavementsTMH 19 — Visual Assessment: StructuresTMH 14 — Automatic Traffic Data FormatTMH 13 — Automated Data Capture: PavementsTMH 8 — Traffic Monitoring ProceduresTMH 3 — Traffic & WIM Monitoring ServicesTRH 26 — Road ClassificationSARTSM Vol 2 Ch 13 — Roadworks SigningSARF Manual 12DORAGRAP 17 · Practice Notes▦ View the Rev B WBS chart (click to expand)
RAMP Schedule & Task Register (linked · editable · 2026–27)
Detailed WBS with sub-tasks from the processes and finish-to-start dependencies. Anchor tasks have an editable Start; every linked task derives its Start from its predecessor, so moving a predecessor cascades to all successors. Red ⚑ marks the DORA statutory reporting deadlines.
| WBS | Task / sub-task | Owner | Pred | Start | Wks | Finish | Feb | Mar | Apr | May | Jun | Jul | Aug | Sep | Oct | Nov | Dec | Jan'27 | Feb'27 | Mar'27 | Apr'27 |
|---|---|---|---|---|---|---|---|---|---|---|---|---|---|---|---|---|---|---|---|---|---|
| ▼ DORA statutory deadlines | ⚑ | ⚑ | ⚑ | ⚑ | ⚑ | ||||||||||||||||
| PHASE A — Governance & Planning | |||||||||||||||||||||
| A1 | Establish & operate RAMS Committee RAMS setup (TMH 22) | Client (HOD) | anchor | 15 Feb | |||||||||||||||||
| A2 | Review & sign off RAMS Policy RAMS setup (TMH 22) | Client (HOD) | anchor | 22 Feb | |||||||||||||||||
| A3 | Confirm Authority ID, DORA & funding RAMS setup (TMH 22) | RAMS PM | A1 | 22 Feb | |||||||||||||||||
| A4 | Set data-collection frequencies (RCAM) RAMS setup (TMH 22) | RAMS PM | A3 | 01 Mar | |||||||||||||||||
| A5 | Appoint & brief service providers RAMS setup (TMH 22) | Client / PM | A4 | 29 Mar | |||||||||||||||||
| A6 | Mobilise & calibrate teams RAMS setup (TMH 22) | Providers | A5 | 19 Apr | |||||||||||||||||
| PHASE B — Network Definition & GIS Update · Network Creation Process | |||||||||||||||||||||
| B1 | Identify roads / confirm Road IDs Network Creation Process | GIS Custodian | A4 +14d | 22 Mar | |||||||||||||||||
| B2 | Divide roads into sections Network Creation Process | GIS Custodian | B1 | 29 Mar | |||||||||||||||||
| B3 | Place nodes Network Creation Process | GIS Custodian | B1 | 29 Mar | |||||||||||||||||
| B4 | Define links (node-to-node) Network Creation Process | GIS Custodian | B3 | 05 Apr | |||||||||||||||||
| B5 | Capture / update geometry (WGS84) Network Creation Process | GIS Custodian | B4 -7d | 12 Apr | |||||||||||||||||
| B6 | Derive km measurements Network Creation Process | GIS Custodian | B5 -7d | 12 Apr | |||||||||||||||||
| B7 | Segment by attribute; build .net Network Creation Process | GIS Custodian | B6 | 19 Apr | |||||||||||||||||
| B8 | Classification (.rcl) & Lane (.lan) Network Creation Process | GIS Custodian | B7 -7d | 19 Apr | |||||||||||||||||
| B9 | Version & write network files Network Creation Process | GIS Custodian | B8 | 26 Apr | |||||||||||||||||
| B10 | Load network before new data Network Creation Process | RAMS PM | B9 -14d | 19 Apr | |||||||||||||||||
| PHASE C — Condition & Usage Data Collection · TMH 18 Data & GIS Process | |||||||||||||||||||||
| C1 | VCA Data — Class 1–3 (.flx/.vgi) TMH 18 Data & GIS Process | Assessors | B10 -1d | 15 Aug | |||||||||||||||||
| C2 | VCA Data — Class 4–5 (.flx/.vgi) TMH 18 Data & GIS Process | Assessors | B10 -1d | 15 Aug | |||||||||||||||||
| C3 | Road Surveillance — IRI (.cid) TMH 18 Data & GIS Process | Surveyor | B10 -1d | 15 Aug | |||||||||||||||||
| C4 | Road Surveillance — FWD (.fwd) TMH 18 Data & GIS Process | Surveyor | B10 +13d | 27 Jun | |||||||||||||||||
| C5 | Traffic link volumes (.adt) TMH 18 Data & GIS Process | Surveyor | B10 -1d | 13 Jun | |||||||||||||||||
| C6 | Structures — Struman (5 yr) TMH 18 Data & GIS Process | Inspector | B10 +13d | 13 Jun | |||||||||||||||||
| C7 | Ancillary assets — road signs TMH 18 Data & GIS Process | Surveyor | B10 +13d | 13 Jun | |||||||||||||||||
| C8 | Ongoing data QC TMH 18 Data & GIS Process | RAMS PM | B10 -1d | 15 Aug | |||||||||||||||||
| PHASE D — Validation & QA · TMH 18 Data & GIS Process | |||||||||||||||||||||
| D1 | File-format checks: TMH 18 TMH 18 Data & GIS Process | RAMS PM | C1 +1d | 23 Aug | |||||||||||||||||
| D2 | Data QC + Quality Acceptance TMH 18 Data & GIS Process | QA | D1 -7d | 23 Aug | |||||||||||||||||
| D3 | Independent quality verification TMH 18 Data & GIS Process | Independent QA | D2 -4d | 26 Aug | |||||||||||||||||
| D4 | Finalise network + data for LCCA TMH 18 Data & GIS Process | RAMS PM | D3 -3d | 30 Aug | |||||||||||||||||
| PHASE E — Analysis & Submission · TMH 18 Data & GIS Process | |||||||||||||||||||||
| E1 | Spec for LCCA input (excl. data) TMH 18 Data & GIS Process | Client / PM | anchor | 30 Aug | |||||||||||||||||
| E2 | LCCA: RNIS updates; MTEF budgets TMH 18 Data & GIS Process | RAMS PM | D4 | 20 Sep | |||||||||||||||||
| E3 | LCCA: DTIMS / HDM-4 analysis TMH 18 Data & GIS Process | RAMS PM | E2 | 04 Oct | |||||||||||||||||
| E4 | LCCA: Verification & refinement TMH 18 Data & GIS Process | RAMS PM | E3 | 11 Oct | |||||||||||||||||
| E5 | Submit TMH 18 to NDOT TMH 18 Data & GIS Process | RAMS PM | E2 +9d | 30 Sep | |||||||||||||||||
| PHASE F — Panel Inspections & RAMP | |||||||||||||||||||||
| F1 | Panel Inspections Prep & Co-ord RAMP / Panel | RAMS PM | E4 | 25 Oct | |||||||||||||||||
| F2 | Panel inspection Execution RAMP / Panel | Panel | F1 | 01 Nov | |||||||||||||||||
| F3 | Panel inspection Report & Document RAMP / Panel | RAMS PM | F2 | 15 Nov | |||||||||||||||||
| F4 | RAMP Compilation Finalisation RAMP / Panel | RAMS PM | F3 | 06 Dec | |||||||||||||||||
| F5 | RAMP session RAMP / Panel | All | F4 | 13 Dec | |||||||||||||||||
| F6 | Client sign RAMP RAMP / Panel | Client | F5 | 20 Dec | |||||||||||||||||
| F7 | Submit RAMP to NDOT RAMP / Panel | RAMS PM | F6 | 27 Dec | |||||||||||||||||
| PHASE G — Change Management · linked CR cycle (representative) | |||||||||||||||||||||
| G1 | Raise & register Change Request (CR) Change Management (Road) | Requester / Custodian | anchor | 03 Jun | |||||||||||||||||
| G2 | CR completeness & validity check (→ rework if invalid) Change Management (Road) | GIS / Data Custodian | G1 | 04 Jun | |||||||||||||||||
| G3 | Impact & RAMS safety assessment (classify risk) Change Management (Road) | GIS / Data Custodian | G2 | 08 Jun | |||||||||||||||||
| G4 | CAB approval decision (→ rework if not approved) Change Management (Road) | Change Advisory Board | G3 | 11 Jun | |||||||||||||||||
| G5 | Check-out, edit, automated QA, peer review (loops on fail) Change Management (Road) | GIS Editor / QA | G4 | 18 Jun | |||||||||||||||||
| G6 | Increment version; merge/publish; immutable audit Change Management (Road) | Config / Audit | G5 | 21 Jun | |||||||||||||||||
| G7 | Notify stakeholders / close CR Change Management (Road) | GIS / Data Custodian | G6 | 22 Jun | |||||||||||||||||
DORA Reporting Deadlines (hard dates)
Statutory reporting dates under the Division of Revenue Act (DORA) governing the road-asset (PRMG / RRAMS) conditional grant. Fixed deadlines the RAMP schedule must satisfy.
| Reporting deliverable | Hard date | Basis |
|---|---|---|
| Monthly infrastructure / financial report | 15th of each month | Within 15 days after month-end (DORA, all conditional grants) |
| Q1 performance report (Apr–Jun) | 30 Jul 2026 | Within 30 days of quarter-end |
| Q2 performance report (Jul–Sep) | 30 Oct 2026 | Within 30 days of quarter-end |
| Q3 performance report (Oct–Dec) | 30 Jan 2027 | Within 30 days of quarter-end |
| Annual road-condition report + RAMS data → NDoT | 15 Mar 2027 | RRAMS grant condition (annual, by 15 March) |
| Q4 performance report (Jan–Mar) | 30 Apr 2027 | Within 30 days of quarter-end |
| DoT + Prov. Roads Authorities evaluate business plans / progress | 30 Apr 2027 | RRAMS grant condition (by 30 April) |
Data-currency conditions (grant requirement)
- RISFSA Class R1–R3: visual ≤ 2 yr; bridges ≤ 5 yr; roughness / rut / texture ≤ 2 yr; structural ≤ 5 yr; traffic ≤ 3 yr.
- RISFSA Class R4–R5: visual ≤ 3 yr; bridges ≤ 5 yr; traffic ≤ 5 yr.
- All condition reports & data submitted to NDoT and the Provincial Roads Authority in COTO / TMH 22 / TMH 18 / TRH 26 format.
Sources: RRAMS grant framework (DoRA) — road-condition report to DoT by 15 March; evaluation by 30 April. General DoRA cadence — monthly reports within 15 days of month-end; quarterly within 30 days of quarter-end. Confirm exact provincial PRMG business-plan dates against the current year grant framework.
FS RAMS — Road Network Dashboard
The Free State provincial road network at a glance — extent, composition by region, service-provider allocation and the 2026–27 data-collection progress. Figures from the service-provider progress reports (May 2026) and the DORA deadlines register.
Table view
| Region | Paved (km) | Unpaved (km) | Total (km) |
|---|---|---|---|
| Thabo Mofutsanyane | 1 290.5 | 5 286 | 6 576.5 |
| Lejweleputswa | 1 451.7 | 4 534.8 | 5 986.5 |
| Xhariep | 698.5 | 4 640.9 | 5 339.4 |
| Fezile Dabi | 1 238.4 | 3 806.7 | 5 045.1 |
| Motheo | 708.9 | 2 313.9 | 3 022.8 |
| Total | 5 388.00 | 20 582.30 | 25 970.30 |
Table view
| Service provider | Paved (km) | Unpaved (km) | Total (km) |
|---|---|---|---|
| SP 4 (Fezile Dabi + Motheo unpaved) ‡ | 1 238.4 | 6 120.6 | 7 359 |
| Lequbu–Nessa JV (Thabo Mofutsanyane) | 1 290.5 | 5 286 | 6 576.5 |
| Q and A Engineers (Lejweleputswa) | 1 451.7 | 4 534.8 | 5 986.5 |
| Nexor JV (Motheo paved + Xhariep) | 1 407.4 | 4 640.9 | 6 048.3 |
Sources: Nexor JV RAMS Progress Report (30 May 2026) — network totals per region & Nexor scope/progress · 2522-LNJV-RP-PRM Progress Report End May 2026 — LNJV & Q and A allocations, LNJV progress · DORA sheet, Planning_for_RAMP_UPDATED.xlsx. Update the figures here after each monthly progress report.
Road Network Dashboard — GIS
The full GIS-based network dashboard (v14, 24 Jul 2026) — interactive map with OSM / Esri basemaps, master network data FSP_20251127 (.NET / .RCL / .LAN — 25 835 km, 7 858 links, RISFSA R1–R5), SANRAL overlap analysis and the COTO / TMH data-readiness gap list. Runs in its own frame below; the basemap tiles need an internet connection, everything else works offline.
The SANRAL layer here is geometric, not legal
The 45 SANRAL routes and the 1 112 km provincial overlap shown below are measured from the FSP_20251127 centrelines. They are not a record of which roads have been declared national by gazette. For the declaration register, the reconciliation against the 2023–2024 gazettes and the open verification items, see 1.6 · SANRAL Declarations & Gazettes.
Source: FS RAMS Road Network Dashboard v14, 24 Jul 2026 (embedded verbatim). The summary Network Dashboard tab keeps the service-provider progress & DORA data-currency view.
RoadSense Live Dashboard
Live RoadSense project dashboard (external). If it does not display below, use the button to open it in a new browser tab.
Open dashboard in new tab ▸Source: app.roadsense.co.za (shared link). This is a live external application served by RoadSense; it is linked, not stored inside this file.
Standards & Verified Reference Index
Every reference used in this document was located in the supplied source PDFs. Printed page is the page number shown on the document page; PDF page is the position in the supplied PDF file.
Reference library
The documents this reference is built on. A controlled project copy is embedded here and downloads without a connection; the rest open the publisher’s copy. Where a published edition differs from the edition cited in this document, that difference is called out on the card.
COTO standards
Departmental documents
TMH 18 CD 5.0, TRH 26 v1.0 and the Draft RAMP are embedded in this file and need no connection. TMH 22 and TMH 14 open the publisher’s copy in a new tab — send those two through and they will be embedded as well. TMH 9 and TMH 19 are cited by name only and are not held here.
Clause-to-page index
| Standard | Clause / Section | What it covers | Printed page | PDF page |
|---|---|---|---|---|
| TMH 18 | §1.1 / Table 1 | Data file format: UTF-8, semicolon (;) delimiter, CR+LF | 10 | 10 |
| TMH 18 | §1.2 | File naming convention AUTHID_ROADID_DATE.ext | 10 | 10 |
| TMH 18 | §1.3 / Table 2 | Authority ID (3–5 char, e.g. FSP) | 11 | 11 |
| TMH 18 | §1.6 / Table 5 | File extensions (.net .rcl .lan .flx .con .blc .vgi .cid .fwd .adt) | 12 | 12 |
| TMH 18 | §1.7 / Table 6 | Base fields required for all data files | 13 | 13 |
| TMH 18 | §2.1 | Roads — Road ID rules, single LineString, dual carriageways | 14 | 14 |
| TMH 18 | §2.2 / Table 7 | Network Definition file (.net) fields | 15 | 15–18 |
| TMH 18 | §2.2.1 | Network measurements (geometry is the measurement base, ≤20 m) | 20 | 20 |
| TMH 18 | §2.2.2 | Network history / road versioning | 20 | 20 |
| TMH 18 | §2.3.1–2.3.2 | Geometry data (SHP / GML 3.1.1) and EPSG:4326 WGS 84 | 21 | 21 |
| TMH 18 | Table 8 | Geometry data fields (GIS_LINKID) | 23 | 23 |
| TMH 18 | §3.1 / Table 9 | Road classification — SEG_ID = ROAD_ID + 5-digit metre-start | 24–25 | 24–25 |
| TMH 18 | Table 10 | Lane configuration — LANE_SEG_ID | 29 | 29 |
| TMH 18 | §4.4 / Table 11 | Traffic link volume (.adt) | 31 | 31 |
| TMH 18 | §5.1 / Table 12 | Standard segment lengths by road type | 34 | 34 |
| TMH 18 | §5.6 | Combined Instrument Data file (.cid) | 59 | 59 |
| TMH 18 | §6.1 | F25 FWD upload file format (.fwd) | 67 | 67 |
| TMH 22 | §B.1.3 | Road network: roads, sections, links, nodes, segments | B-2 | 47 |
| TMH 22 | §B.1.3(a) | Roads | B-2 | 47 |
| TMH 22 | §B.1.3(b) / Figure B.1 | Road links (uniform type, cross-section, pavement, traffic) | B-3 | 48 |
| TMH 22 | §B.1.3(c) | Nodes (intersections, T-junctions, borders, surface change) | B-4 | 49 |
| TMH 22 | §B.1.3(d) | Assessment segments | B-4 | 49 |
| TMH 22 | §B.1.4 | Location referencing | B-5 | 50 |
| TMH 22 | §D.5.3 / Tables D-4, D-5 | Frequency of data collection by RCAM class | D-16 / D-17 | 86–87 |
| TMH 22 | §D.5.4 / Tables D-7, D-8 | Reporting segments & data-collection procedures | D-18 | 88 |
| TMH 22 | §D.5.7 | Data quality control | D-20 | 90 |
| TMH 22 | §D.5.8 | Data quality acceptance | D-20 | 90 |
| TMH 22 | §D.5.9 | Independent quality verification | D-21 | 91 |
| TMH 22 | §A.3 | Organisation — RAM structure, roles & responsibilities | A-2 | 25 |
| TMH 22 | §B.2 | Asset hierarchy | B-6 | 51 |
| TMH 22 | §B.6–B.7 | Acquisition data & fixed asset register | B-16 | 61 |
| TMH 22 | §D.2 | Usage — accidents (SAPS / Traffic Police records) | D-4 | 74 |
| TMH 22 | §E.2 | Condition indices (VCI, CI per component, unpaved, structures) | E-7 | 99 |
| TMH 22 | §E.3 | Functional indices (capacity, riding quality, user risk, safety) | E-15 | 107 |
| TMH 22 | §E.4 | Composite indices (bundling; combined structures index) | E-29 | 121 |
| TMH 22 | §F.7 | Minimum condition & functional indices (national standards) | F-8 | 134 |
| TMH 22 | §F.8 | Road-user costs | F-11 | 137 |
| TMH 22 | §F.9 | Accident costs | F-17 | 143 |
| TMH 22 | §F.11 | Problem statements | F-22 | 148 |
| TMH 22 | §G.7–G.8 | Prioritisation & optimisation | G-10 | 158–160 |
| TMH 22 | §G.9 | Recommended treatments | G-17 | 165 |
| TMH 22 | §H.2 | Operational efficiency | H-3 | 180 |
| TRH 26 | §3.6 | Six-class functional road classification | 17 | 29 |
| TRH 26 | §4.4 | Rural road classification system (R1–R6) | 23 | 35 |
| TRH 26 | §4.5 | Urban road classification system (U1–U6) | 26 | 38 |
| TMH 14 | §2.2 | Traffic data file names — SiteId-YYYY / -YYYYMMDD / -YYYYMMDD-hhmmss.RSV | 4 | 17 |
| TMH 14 | §2.3 | Traffic data file structure — header block H0 … H9, then traffic data | 6 | 19 |
| TMH 14 | §2.4 | Comma-delimited format — printable ASCII 32–127, text in double apostrophes | 6 | 19 |
| TMH 14 | §2.6 | Clock & time conventions — site Standard Time, continuous (no DST) | 9 | 22 |
| TMH 14 | §2.7 | Summary intervals — 1, 2, 3, 4, 5, 6, 10, 12, 15, 20, 30 or 60 minutes | 10 | 23 |
| TMH 14 | §3.1 | Site Identifiers — managed by SANRAL; changed site definition ⇒ new Site Id | 11 | 24 |
| TMH 14 | §3.2 | Traffic streams — max 8 per site; direction codes 0–9 | 11–12 | 24–25 |
| TMH 14 | §3.3 | Traffic lanes — ≤32 physical + ≤32 virtual (≤64 assigned) | 14 | 27 |
| TMH 14 | §5.12 | Scheme 08 vehicle classes (South Africa) | 32 | 45 |
TMH 9 (visual assessment of roads) and TMH 19 (visual assessment of structures) are cited by name only — those documents were not supplied, so no page reference is given for them.
Department Standard Operating Procedure — at a glance
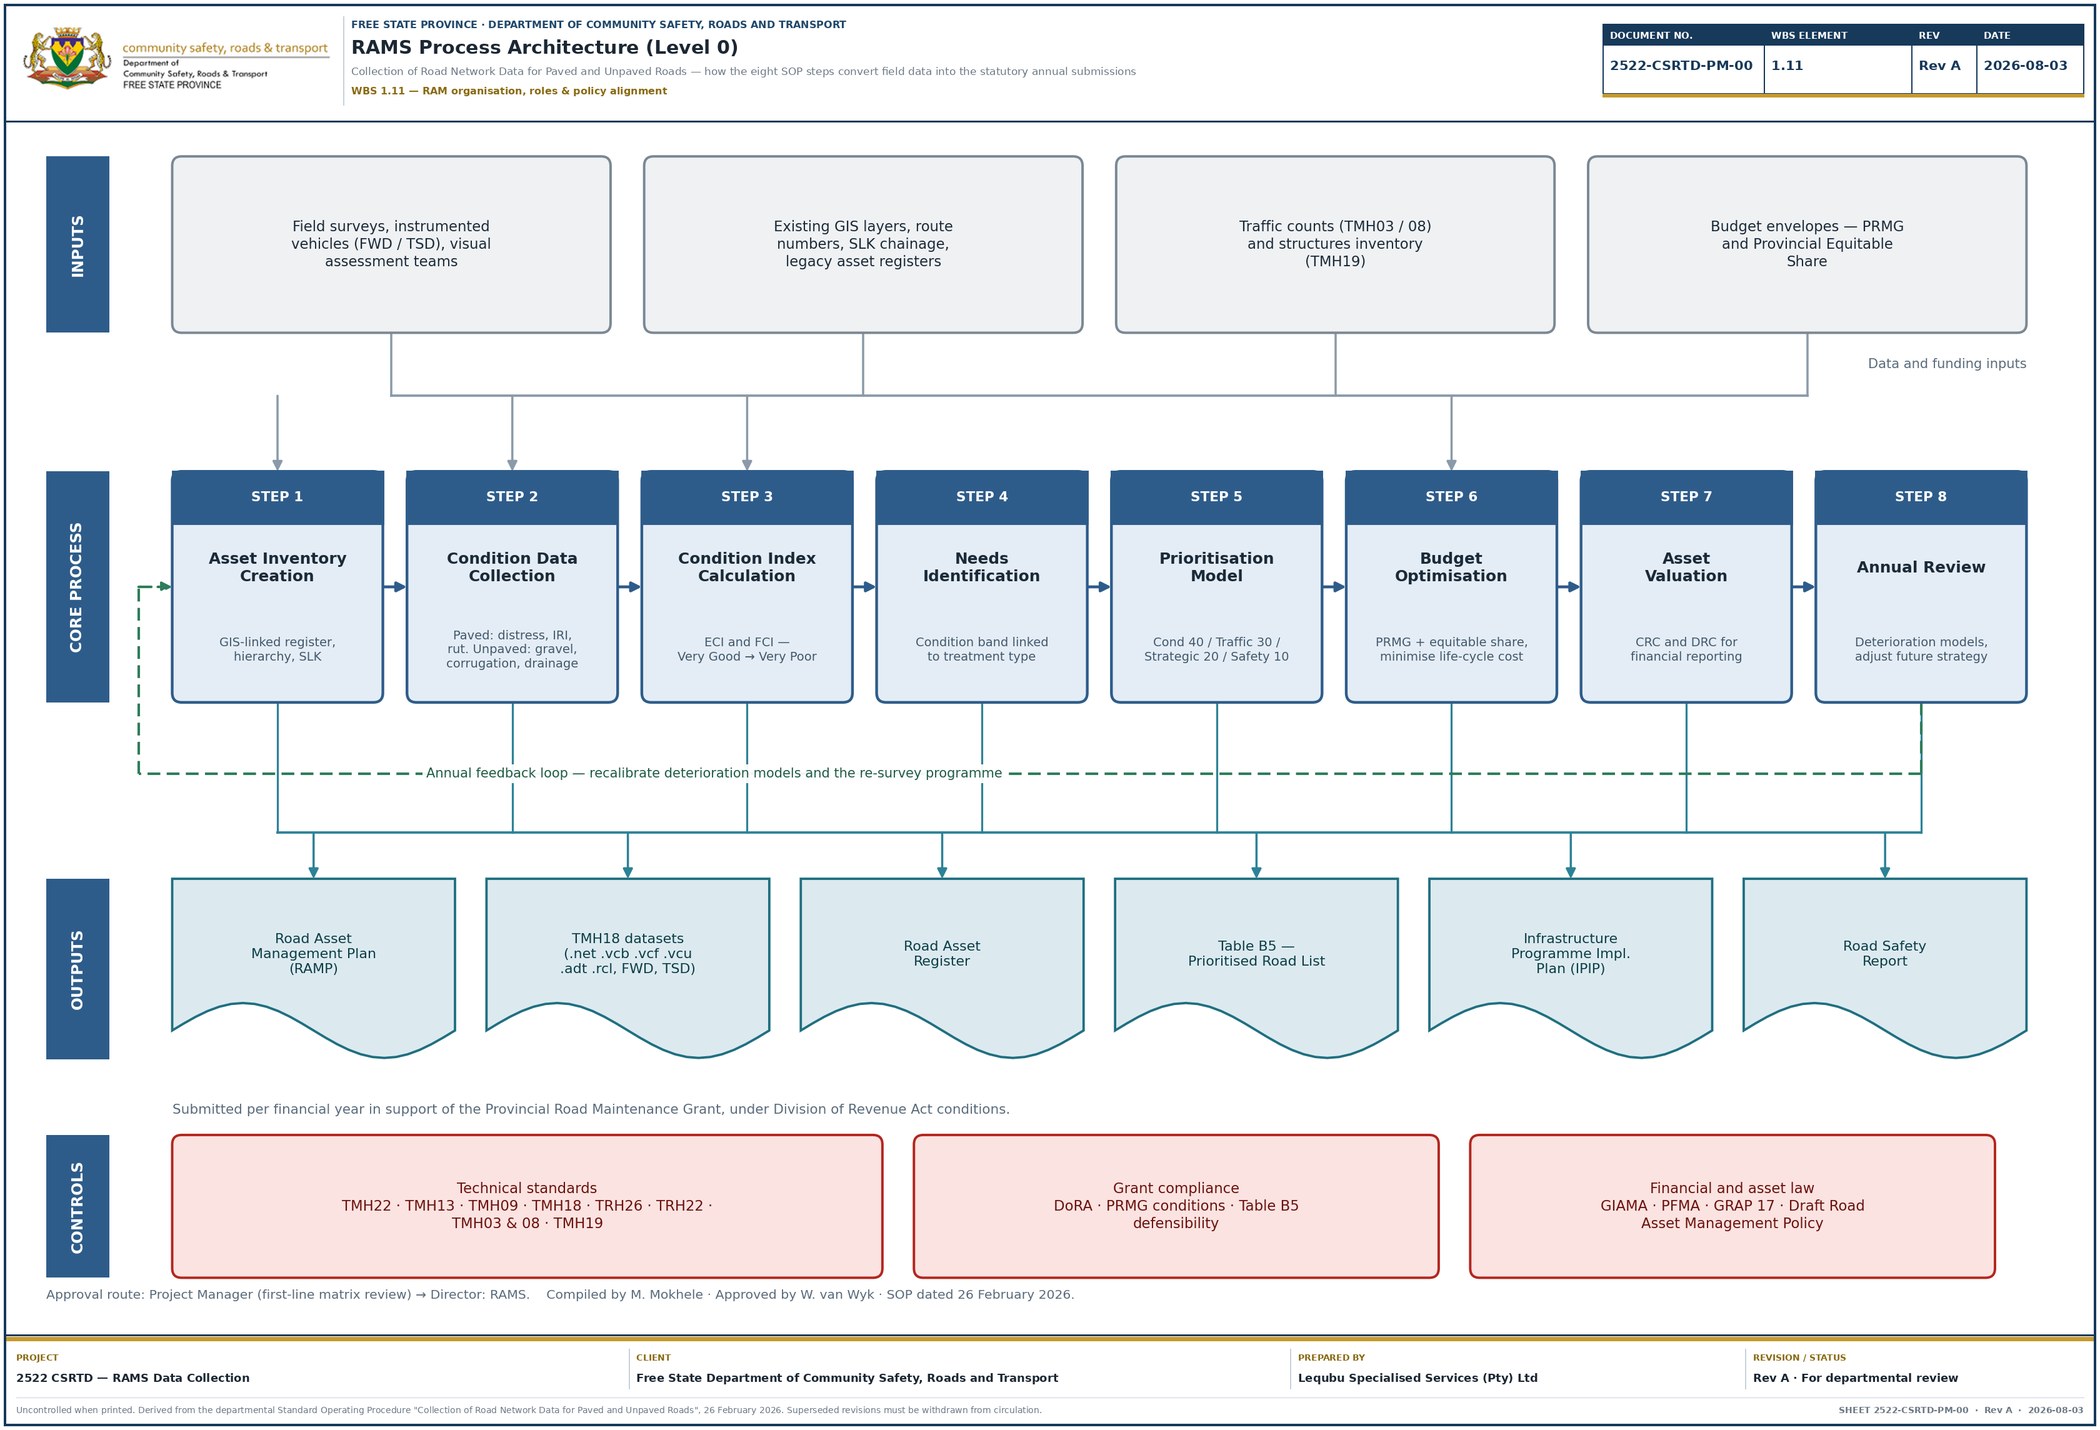
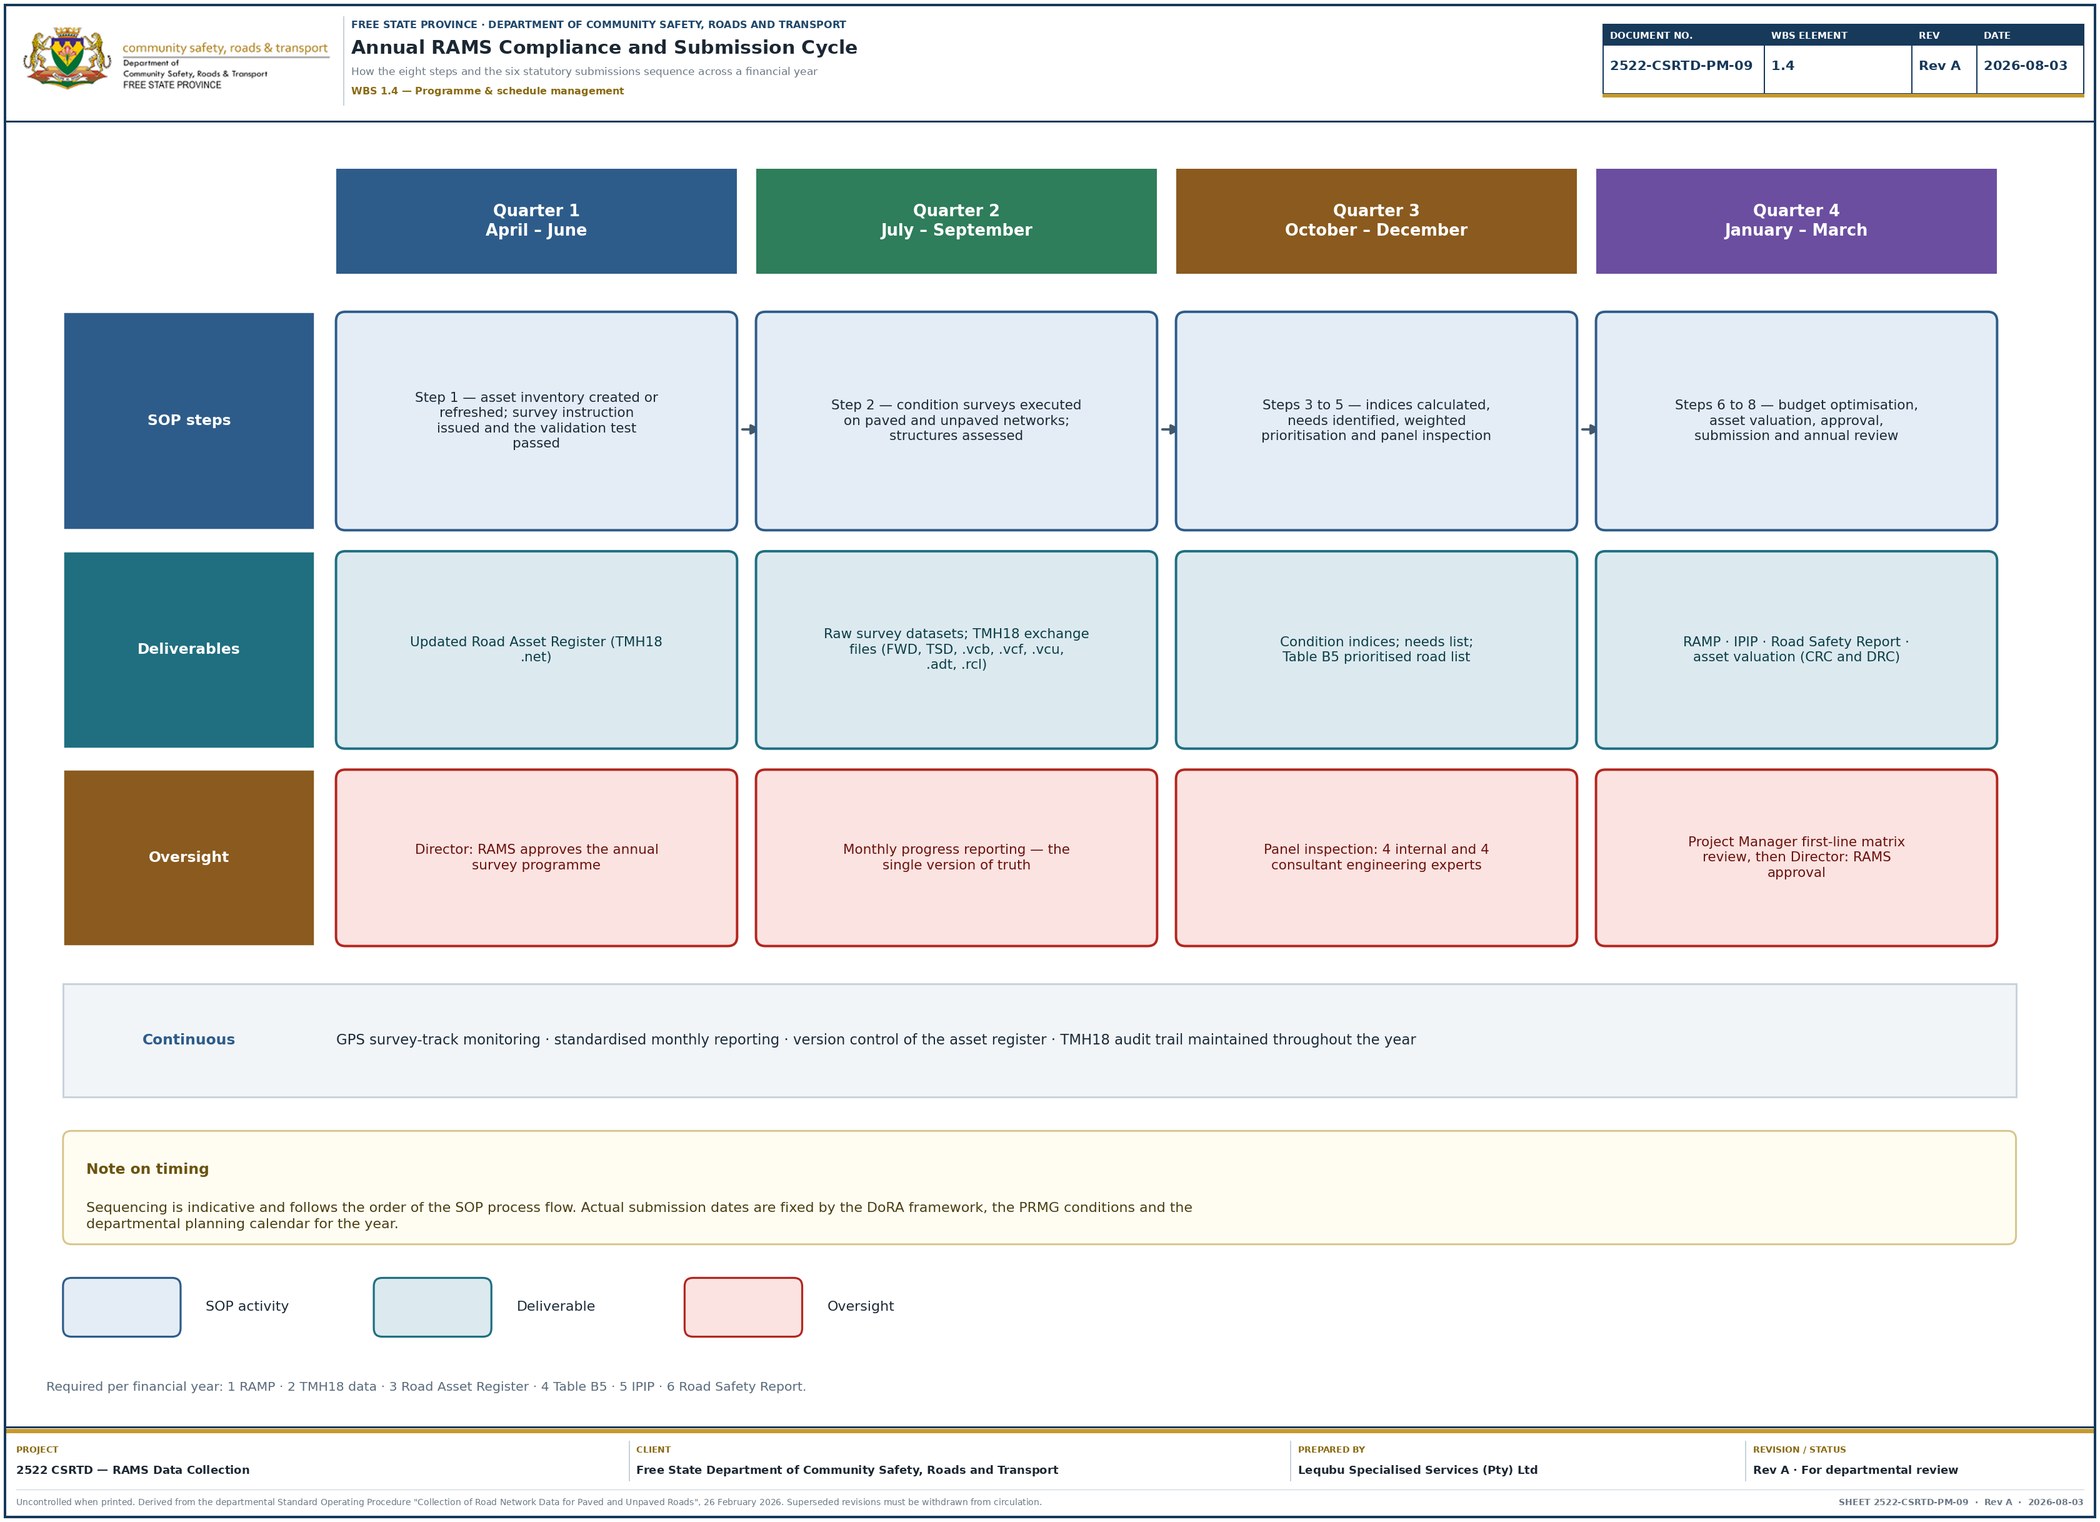
Collection of Road Network Data for Paved and Unpaved Roads. This tab is the high-level view of the departmental SOP that governs everything else in this reference: the eight-step process flow, who is responsible, what must be produced each financial year and the controls the process runs under. Every other tab in this document is arranged in the order of that flow.
Purpose
To establish a regulated and controlled framework for the implementation, operation and governance of the Road Asset Management System, so as to ensure:
- Compliance with Division of Revenue Act (DoRA) requirements.
- Accurate and verifiable reporting of road infrastructure condition and performance.
- Evidence-based planning, budgeting and prioritisation of maintenance interventions.
- Proper stewardship and lifecycle management of publicly funded road assets.
- Audit readiness through documented processes, controls and accountability mechanisms.
Scope
All activities relating to the collection, processing, validation, storage, analysis and reporting of road asset information for paved and unpaved road networks under the authority of the Department — asset inventory management, road condition and performance monitoring, and the planning and prioritisation that follows from it.
The eight-step process flow
Click a step to jump to the tab that holds the detailed process maps for it.
Responsible participants
| Participant | Role in the process |
|---|---|
| Director: RAMS | All approvals — the annual survey programme and the submission set. |
| Programme Manager | Annual survey scope, network extent and budget envelope; strategic importance weighting. |
| Project Manager | First line of the matrix review; survey instructions, quality gates and monthly reporting. |
| Project Engineer (Civil) | Technical oversight of survey execution and treatment rules. |
| Pavement Engineer | Condition indices, structural interpretation, treatment selection. |
| Traffic Engineer | Traffic counts and loading (TMH 03 / TMH 08) and the traffic weighting. |
| Structural Engineer (COTO certified) | Major culverts and bridges (TMH 19). |
| Asset Manager (financial and accounting background) | Budget optimisation and asset valuation for GRAP reporting. |
| Data and System Analyst | GIS-linked register, GPS track monitoring, TMH 18 packaging, system integrity. |
| Road Safety Manager | Safety risk rating and incident data; the Road Safety Report. |
Required submissions per financial year
Legislative framework and qualifying criteria
The framework is anchored in Provincial Road Maintenance Grant (PRMG) conditions under DoRA, so that project identification and Table B5 programming are underpinned by credible, auditable data. Compliance is maintained through alignment with TMH 22 (technical standards for road asset management), GIAMA and the PFMA (immovable asset management and financial accountability) and GRAP (accurate asset valuation for National Treasury).
Data collection follows the TMH 22 guidelines at the stipulated frequency. The Department applies a multicriteria prioritisation model for Table B5 every financial year, and the selected roads for maintenance are verified through panel inspections comprising four internal engineering road experts and four from the consultants.
How this reference is arranged
4.1 · Needs Identification and the Prioritisation Model
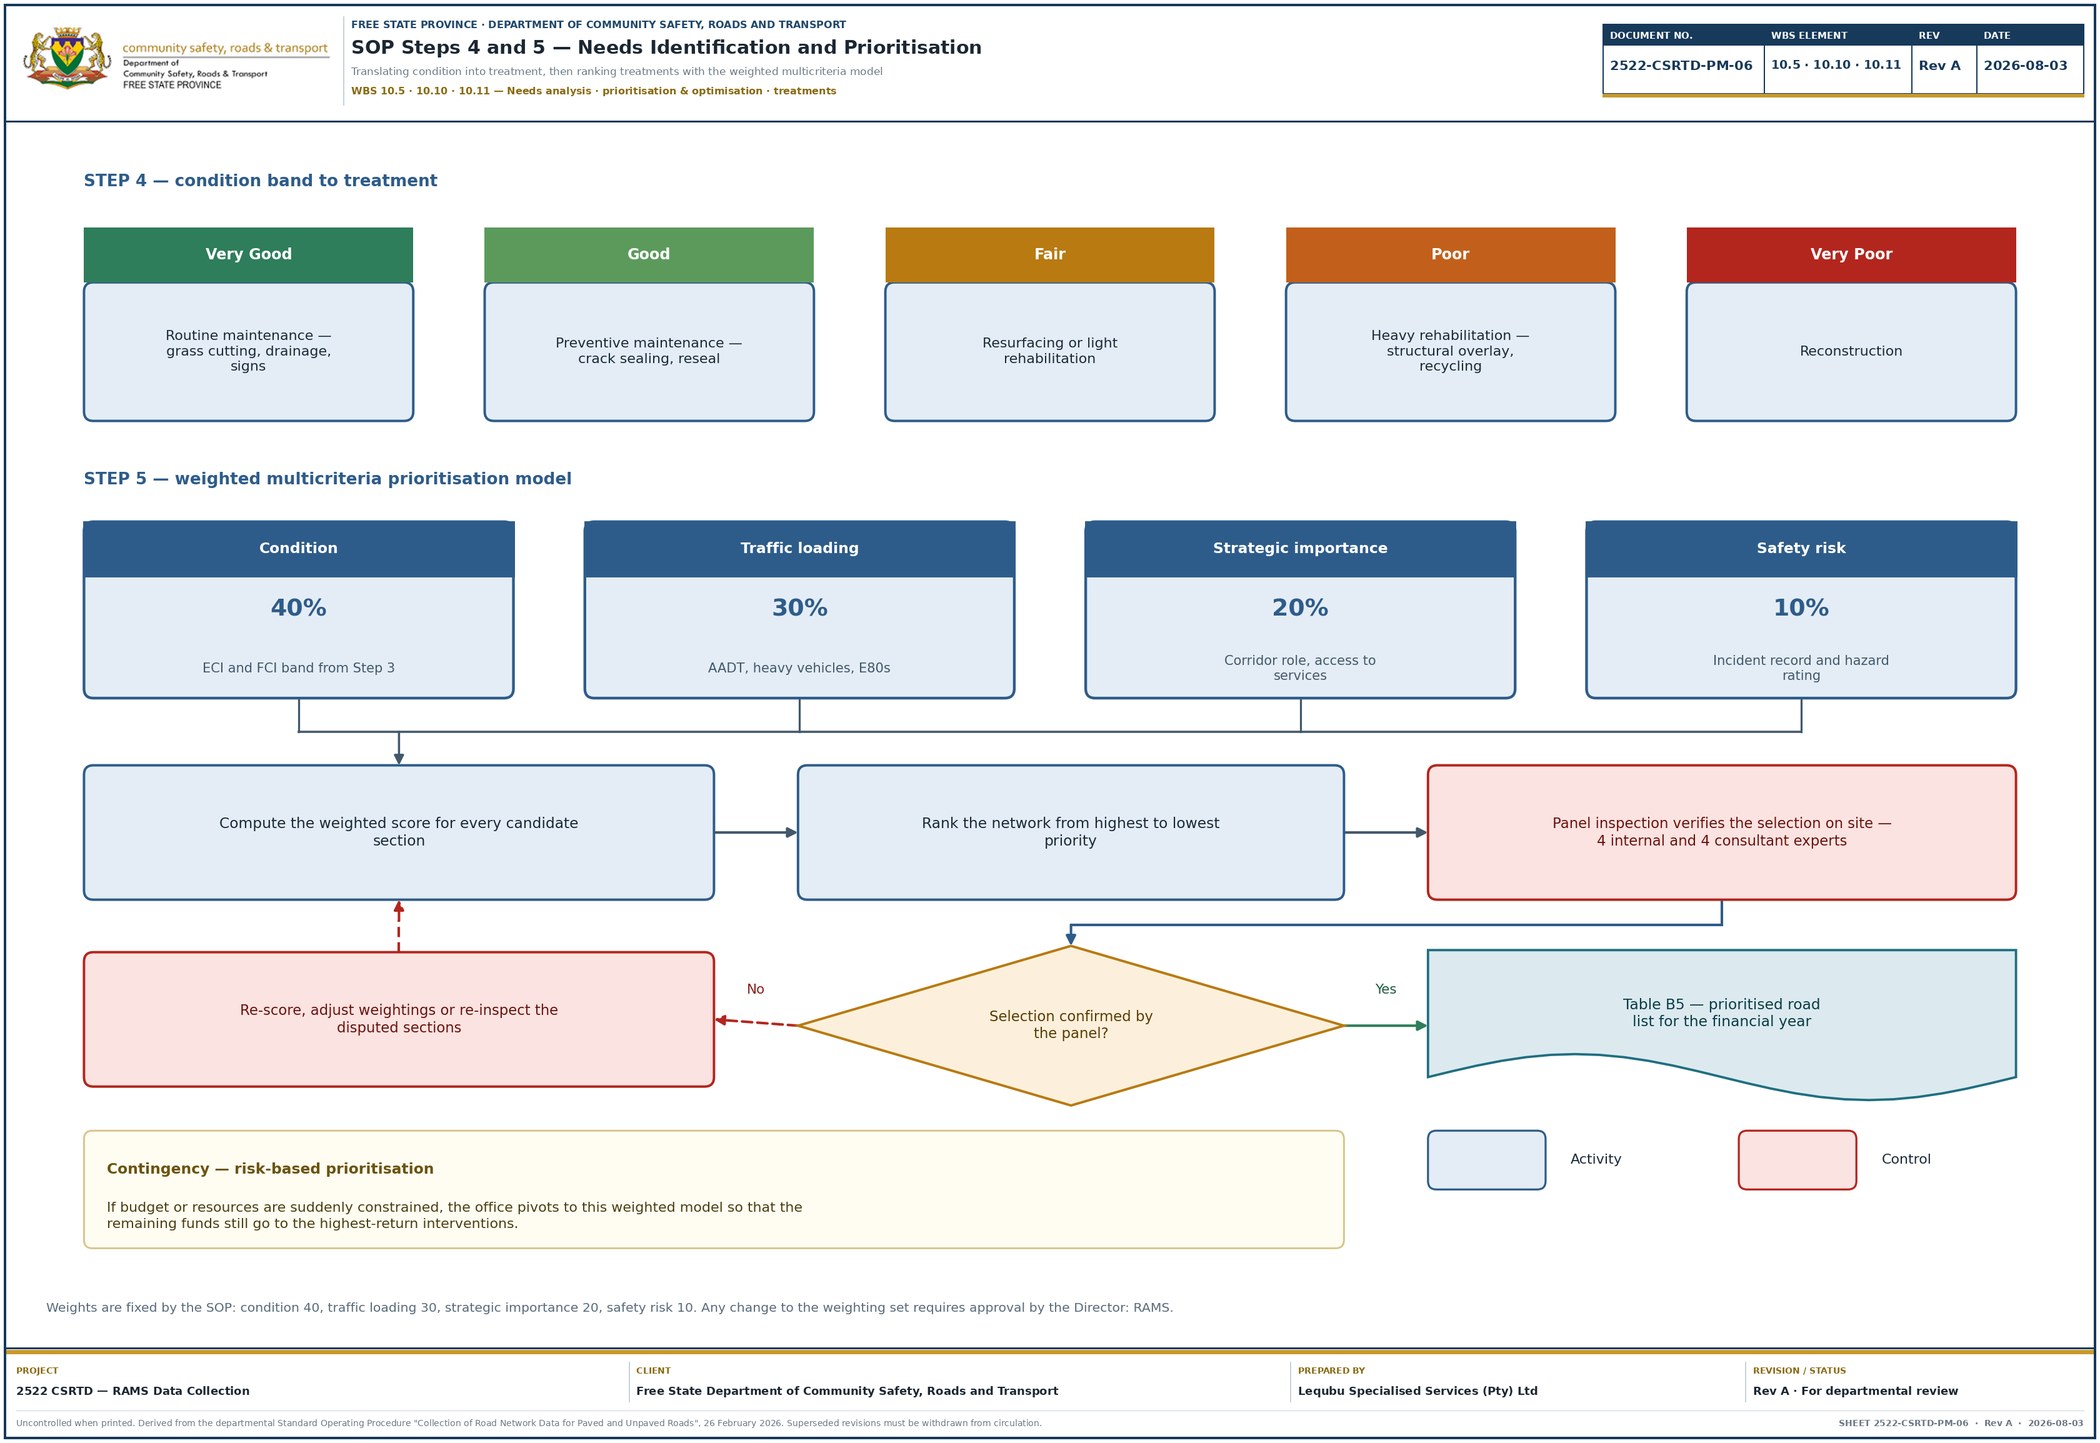
SOP Step 4 links every condition band to a defined treatment; Step 5 ranks the resulting candidate interventions on the weighted multicriteria model. The output is the Table B5 prioritised road list, verified on site by panel inspection before it is finalised.
Fixed weightings
- Treatment rules run from routine maintenance for Very Good sections through to reconstruction for Very Poor sections.
- The condition input is the ECI and FCI band produced in Step 3 — see the Condition Indices tab.
- Panel inspection — four internal engineering experts and four from the consultants — is a precondition for finalising Table B5.
- Any change to the weighting set requires approval by the Director: RAMS.
5.1 · Budget Optimisation and Asset Valuation
SOP Step 6 matches the prioritised needs to the available PRMG and Provincial Equitable Share envelopes while minimising life-cycle cost; Step 7 values the network for financial reporting. Together they produce the IPIP and the valuation that supports the Treasury submission.
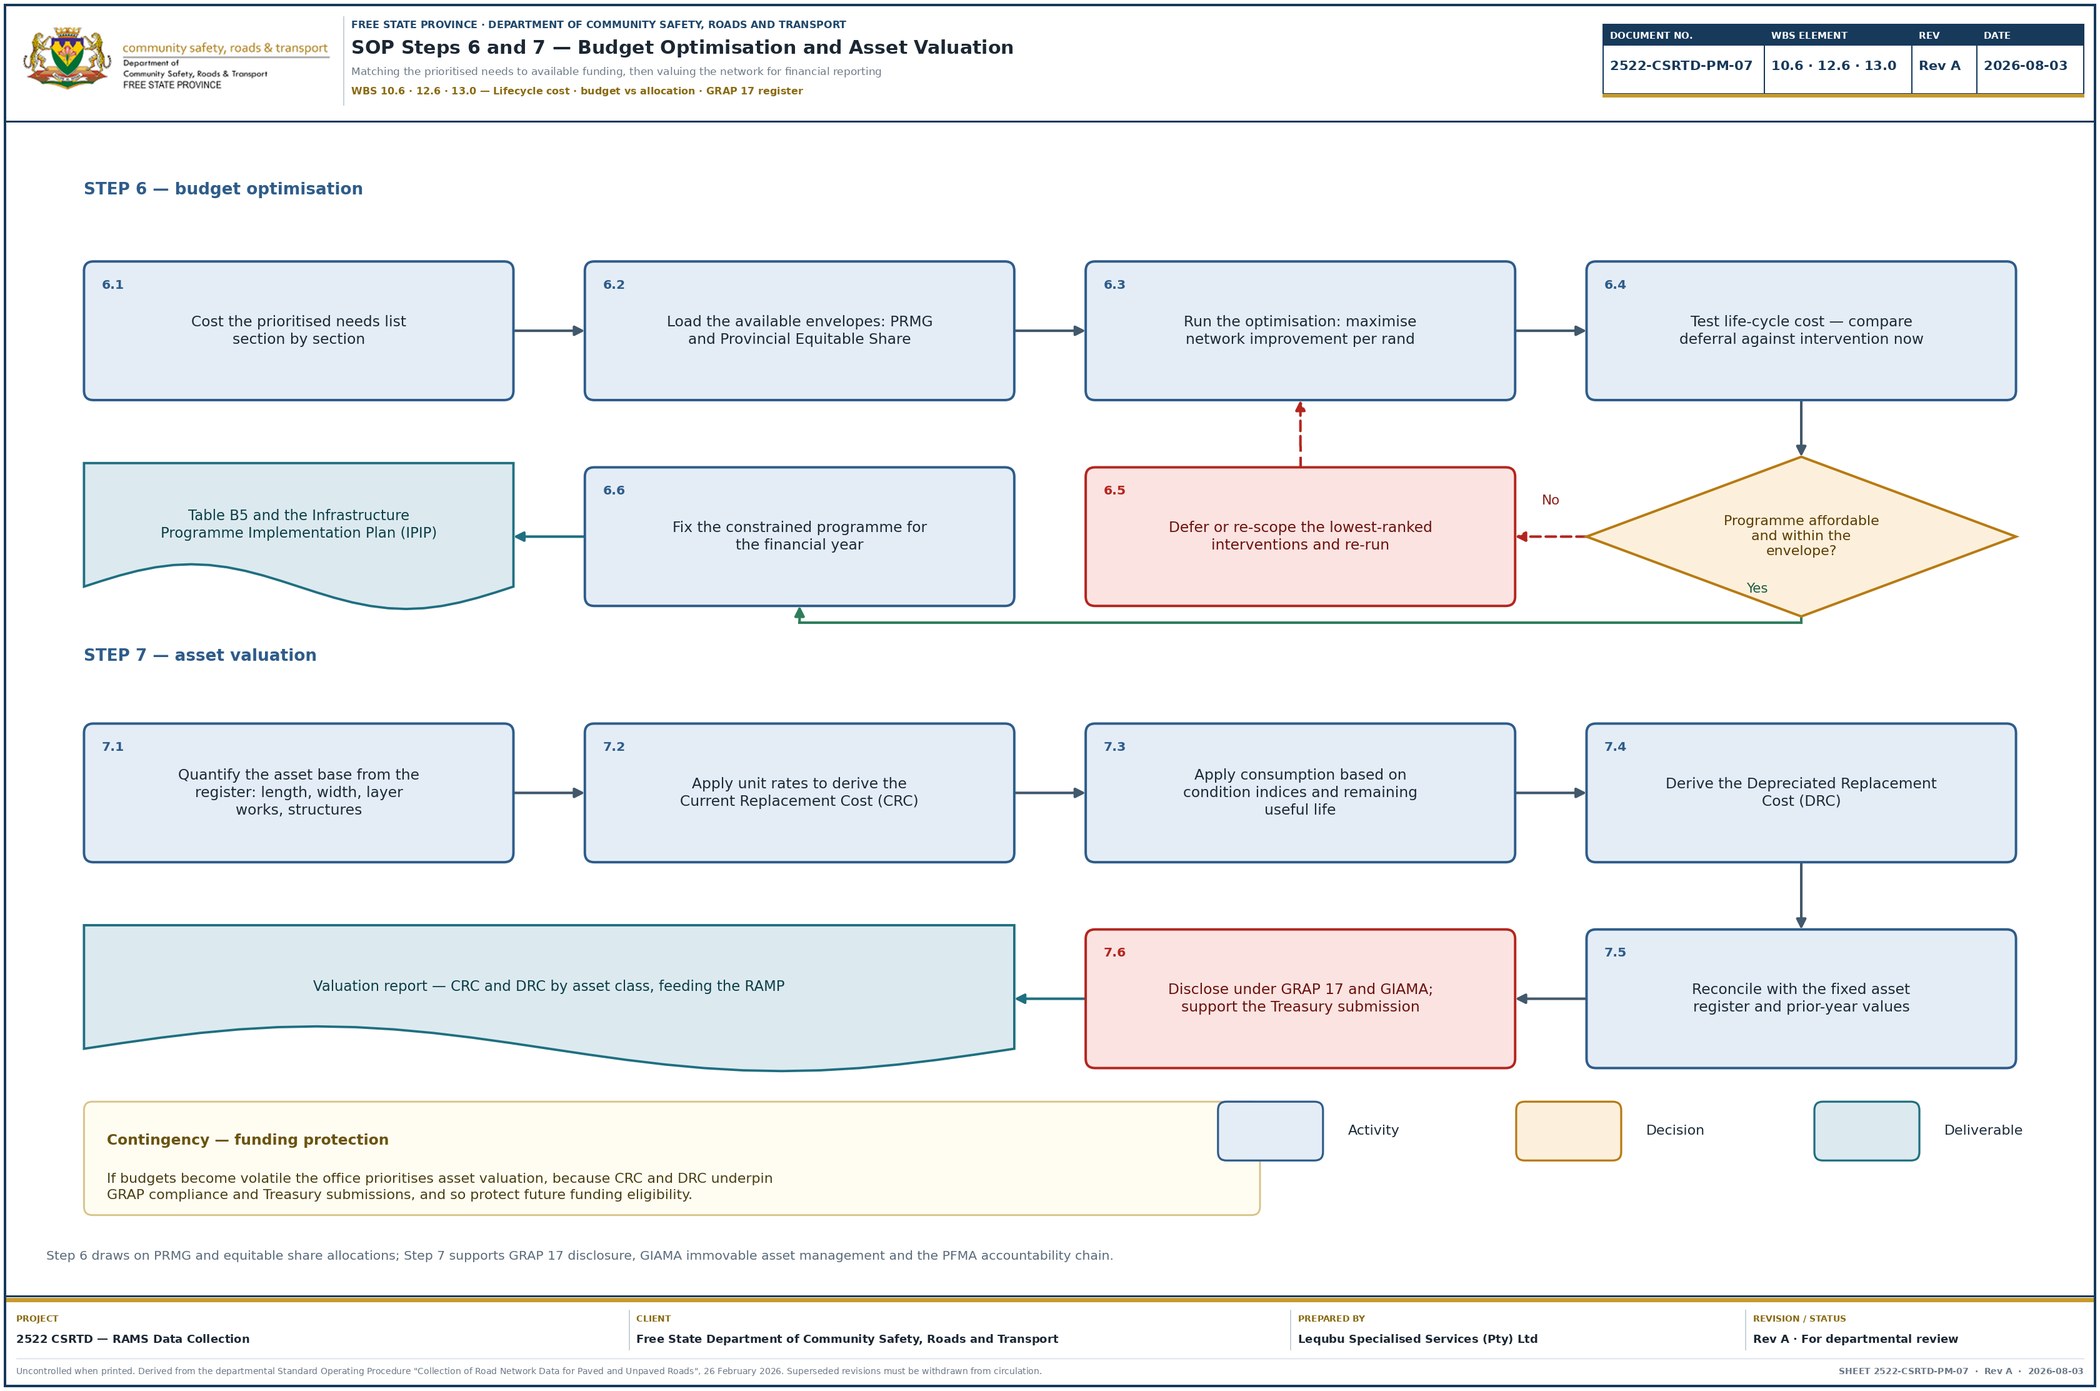
- Unaffordable work is deferred or re-scoped and the optimisation re-run, rather than the ranking being overridden.
- Valuation derives the Current Replacement Cost, then applies consumption based on condition indices and remaining useful life to give the Depreciated Replacement Cost.
- Valuation outputs support GRAP 17 disclosure, GIAMA immovable asset management and the PFMA accountability chain.
- Statutory dates for the resulting submissions are on the DORA Deadlines tab.
6.1 · Annual Review and Continuous Improvement
SOP Step 8 closes the loop. Predicted deterioration is compared with the condition actually measured, the deterioration models are recalibrated and the survey programme, treatment rules and — where necessary — the SOP itself are adjusted before the next cycle begins.
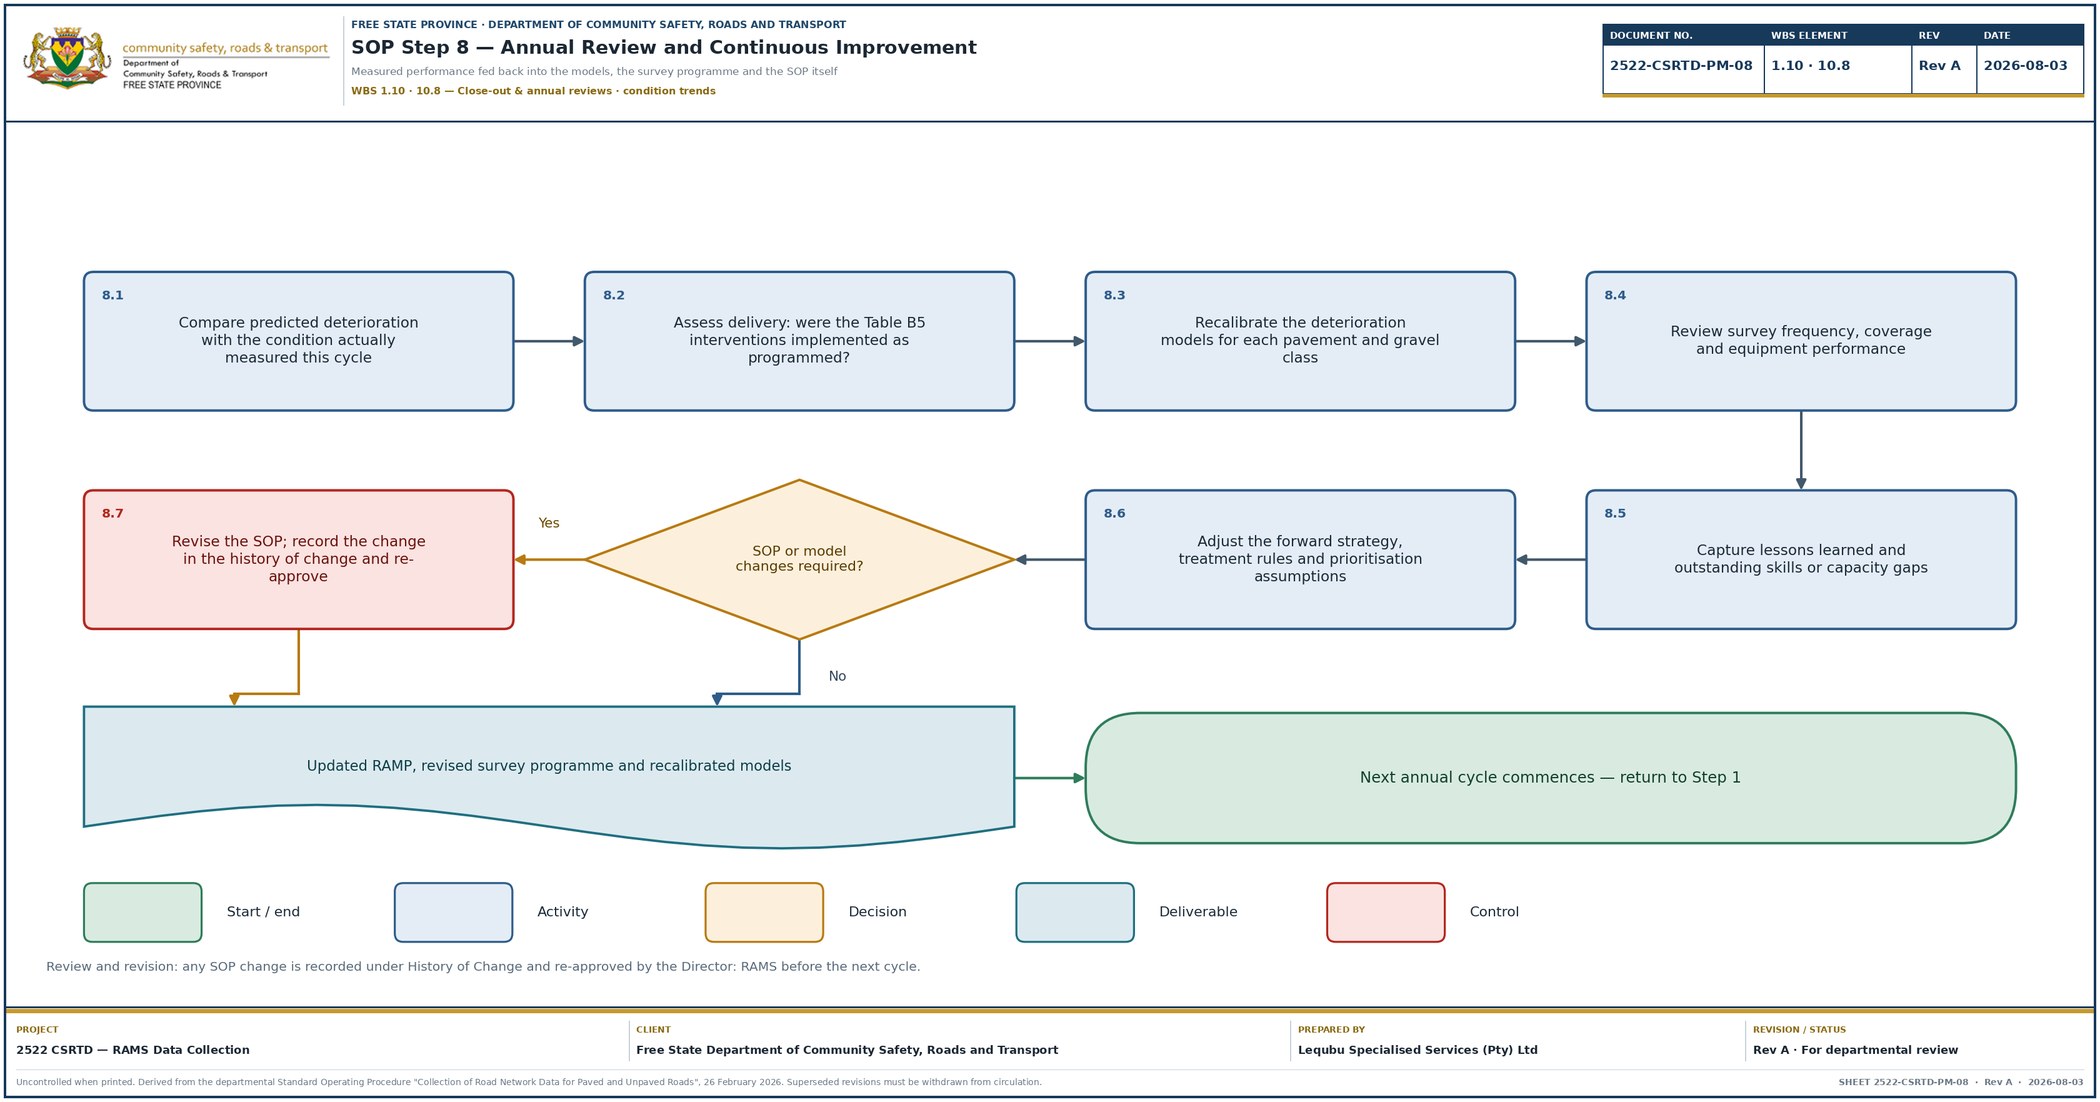
- Delivery performance against Table B5 is reviewed alongside condition performance.
- Skills and capacity gaps identified here drive the training framework in the Contingency tab.
- Any SOP change is recorded under History of Change and re-approved by the Director: RAMS before the next cycle.
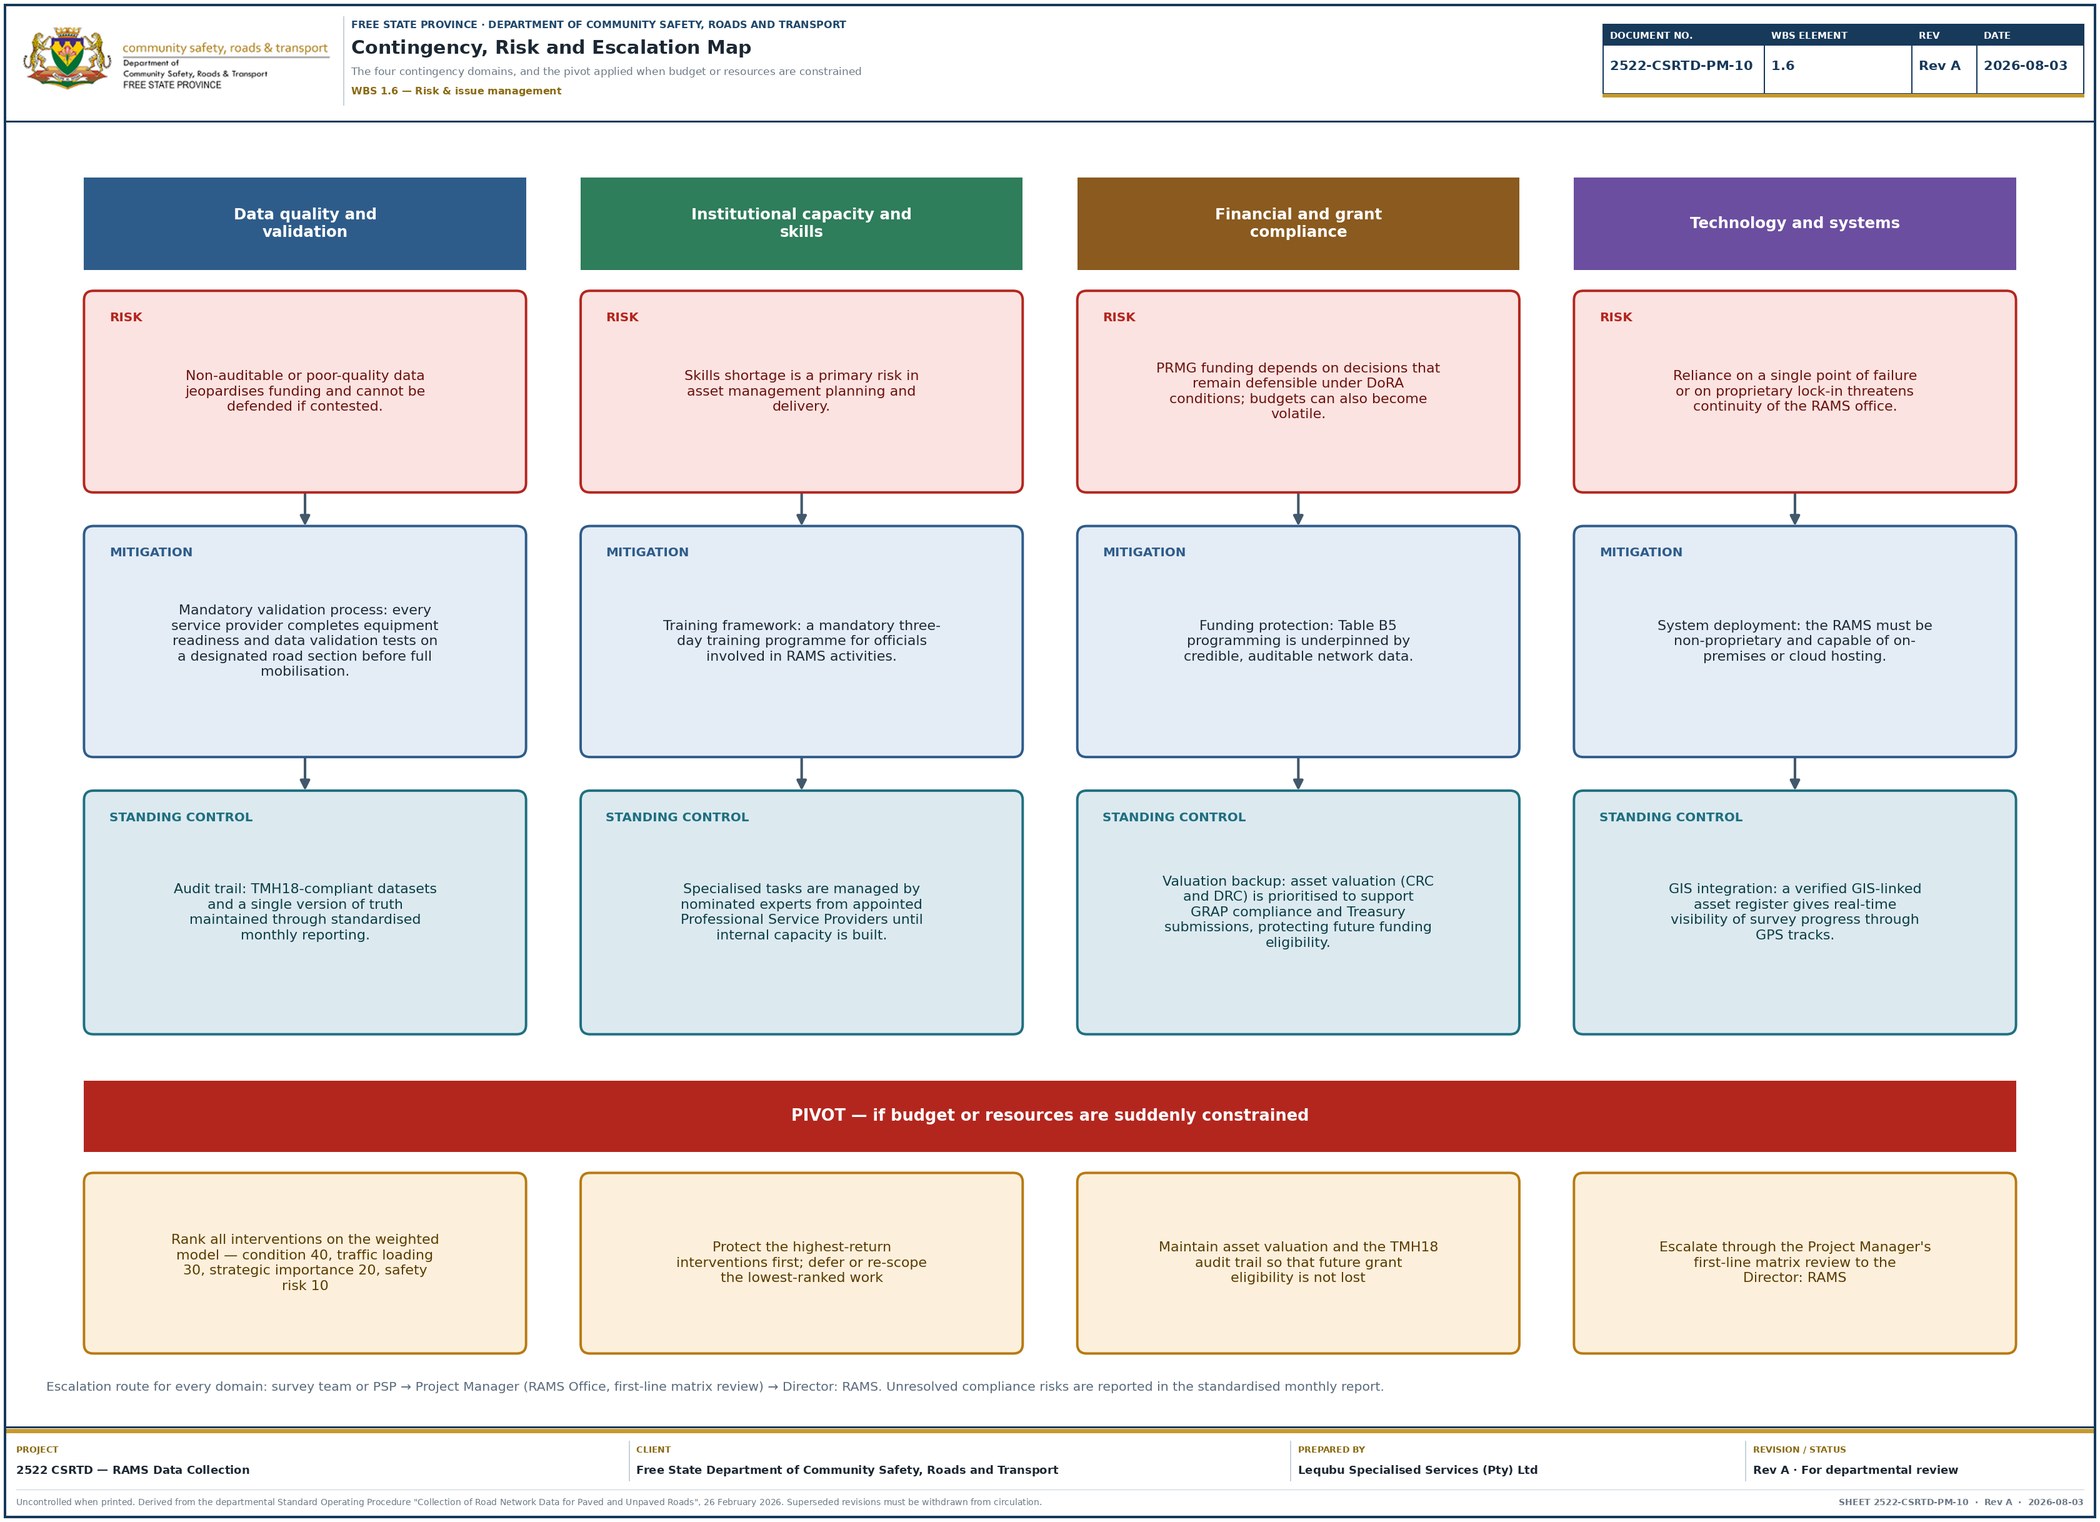
Contingency, Risk and Escalation
The SOP sets out four contingency domains that keep the RAMS office functional and compliant, plus the position the office pivots to when budget or resources are suddenly constrained. These apply across every step of the process flow, not at a single point in it.
Data quality and validation
Non-auditable or poor-quality data jeopardises funding and cannot be defended if contested.
All service providers must complete equipment readiness and data validation tests on a designated road section before full mobilisation.
TMH 18-compliant datasets and a single version of truth maintained through standardised monthly reporting.
Institutional capacity and skills
Skills shortage is identified as a primary risk in asset management planning.
A mandatory three-day training framework for officials involved in RAMS activities.
Specialised tasks are managed by nominated experts from appointed Professional Service Providers.
Financial and grant compliance
PRMG funding depends on decisions remaining defensible under DoRA; budgets can also become volatile.
Table B5 programming is underpinned by credible, auditable network data.
Asset valuation (CRC and DRC) is prioritised to support GRAP compliance and Treasury submissions, protecting future funding eligibility.
Technology and systems
Reliance on a single point of failure or on proprietary lock-in threatens continuity.
The RAMS must be non-proprietary and capable of on-premises or cloud hosting.
A verified GIS-linked asset register gives real-time visibility of survey progress through GPS tracks.
1.6 · SANRAL Declarations & Gazette Register
Roads declared national under the South African National Roads Agency Limited and National Roads Act leave the provincial register and become SANRAL's responsibility. TMH 22 requires a single accountable custodian per asset, so every declaration must be reflected in the road network definition (WBS 3.2) before condition data is scoped — otherwise the Department either surveys roads it no longer owns or omits roads it still does.
Verification result — the gazette register and the GIS dashboard are NOT the same thing
The SANRAL layer in the GIS dashboard is a geometric layer: 45 route numbers, 298 plotted sections, drawn from the master network data FSP_20251127. It carries no gazette number, notice number or declaration date, and it includes long-standing national routes (N1, N3, N5, N6, N8, N12) alongside D-, M- and P-roads that are not part of any 2023–2024 declaration.
All six gazetted route numbers (R26, R34, R74, R700, R710, R30) do appear in the layer — but the kilometres do not reconcile with the declared extents, and P92, the only road named in the 674 km November 2024 notice, is absent from the layer altogether. The layer answers "where do SANRAL centrelines coincide with our roads"; the gazettes answer "which roads have legally left our register". Both are needed; neither substitutes for the other.
Gazette register — Free State provincial roads declared national, 2023–2024
| Year | Gazette / notice | Date | Road | Route described | Length | Gazette no. |
|---|---|---|---|---|---|---|
| 2023 | Government Gazette dated 27 Oct 2023 (announced 3 Nov 2023) | 27 Oct 2023 | R26 | Ladybrand – Clocolan – Ficksburg – Fouriesburg – Bethlehem | 163 km | Not yet confirmed |
| 27 Oct 2023 | R34 | North West border (Bloemhof side) → Hoopstad / Bothaville / Kroonstad / Vrede → KZN border | 406 km | |||
| 27 Oct 2023 | R74 | Harrismith → Oliviershoek Pass (KZN border) | 31 km | |||
| Tranche subtotal | ±568.75 km | |||||
| 2024 | Duties delegated Feb 2024 | Feb 2024 | R700 | Bloemfontein – Bultfontein | — | Not yet confirmed |
| Feb 2024 | R710 | Bultfontein – Welkom | — | |||
| Feb 2024 | R30 | R730 intersection (north of Theunissen) – Odendaalsrus | — | |||
| Tranche subtotal | ±222.70 km | |||||
| 2024 | GG 54066, Notice 7072 — R34 declaration amendment | 2024 | R34 Section 3 | North West / Free State border → Hoopstad | — | Confirmed |
| 2024 | GG 51639, Notice R.5578 — "Declaration of Existing Provincial Roads: Free State" | 22 Nov 2024 | P92 Section 1 + others in the schedule | Includes the route up to Caledonspoort border post (Xhariep) | 674 km | Confirmed |
| Grand total declared, 2023–2024 | ±1 465 km | |||||
Two carried-forward caveats. First, the gazette number is confirmed only for GG 51639 (R.5578) and GG 54066 (Notice 7072) — the October 2023 and February 2024 tranches are pinned by date but not yet by gazette number. Second, the 674 km November 2024 notice contains a full per-road schedule that is not reproduced in any press release, so only P92 Section 1 is named above. Until the gazette PDFs are obtained and read, the per-road breakdown of that 674 km is unknown.
Reconciliation — declared extent against the plotted SANRAL layer
Kilometres below are measured directly from the geometry plotted in the GIS dashboard (FSP_20251127, WGS 84 great-circle length of each plotted section), alongside the figure the dashboard's own summary chart reports.
| Gazetted road | Declared | In SANRAL layer | Plotted geometry | Dashboard chart | Reconciles? |
|---|---|---|---|---|---|
| R26 | 163 km | Yes — R026 | 478.0 km | 478 km | No — 2.9× |
| R34 | 406 km | Yes — R034 | 501.4 km | 366 km | No — and the layer disagrees with itself |
| R74 | 31 km | Yes — R074 | 32.1 km | not in top 6 | Yes — within 1 km |
| R700 | — (tranche ±222.7 km) | Yes — R700 | 87.2 km | not in top 6 | No — 407 km plotted vs ±223 km declared |
| R710 | — | Yes — R710 | 68.9 km | not in top 6 | |
| R30 | — | Yes — R030 | 251.1 km | 174 km | |
| P92 Section 1 | part of 674 km | No — absent | — | — | Not represented |
| Whole SANRAL layer — 45 routes, 298 sections | 4 463 km | 2 927 km | Internal gap of ~1 536 km | ||
What the dashboard's overlap figure actually measures
The dashboard's headline 1 112 km / 52 segments "Provincial ↔ SANRAL overlap" is a geometric coincidence test between provincial paved P-roads and SANRAL centrelines — it is a scoping flag, not a record of legal transfer. Its largest pairs are P59/1–2 ↔ R64 (116.0 km), P46/1 ↔ R59 (84.7 km), P6/1 ↔ R702 (72.3 km), P56/1 ↔ R721 (72.0 km) and P18/2 ↔ R26 (61.6 km). Only one of those five SANRAL routes appears in the 2023–2024 gazette register at all. Gravel is effectively unaffected (0.3 km).
Three different quantities are therefore in circulation and must not be conflated: ±1 465 km declared by gazette · 1 112 km of geometric provincial-SANRAL overlap · 2 927 km (or 4 463 km) of plotted SANRAL routes in the province.
Open items before the register can be closed out
- Obtain the gazette PDFs for the October 2023 and February 2024 tranches and record the gazette and notice numbers.
- Extract the full per-road schedule from GG 51639 / Notice R.5578 — every road, section and kilometre point making up the 674 km.
- Resolve the internal inconsistency in the SANRAL layer: 2 927 km reported against 4 463 km of plotted geometry, and R34 charted at 366 km against 501 km plotted (N1 shows the same pattern — 230 km charted, 717 km plotted).
- Tag every SANRAL-declared section in the network definition with its gazette reference, so the asset register carries a legal basis for each exclusion (TMH 22 — single accountable custodian).
- Re-run the scoping check on the Table B5 candidate list once the exclusions are applied, so declared roads are not surveyed or programmed by the Department.